 Java, Spring and Web Development tutorials  1. Introduction
Apache Camel is a Java-based integration framework that implements Enterprise Integration Patterns (EIPs).
In this article, we’ll demonstrate how to use Apache Camel observability-related components to monitor application health and performance.
2. Maven Dependencies
The two variants of this application, Spring Boot and Standalone, send spans and traces by utilizing different tools. To that end, it’s crucial to present the dependency lists separately.
2.1. Spring Boot
To start, for the Spring Boot examples, we need to define the dependencies for spring-boot-starter, camel-spring-boot-starter, spring-boot-starter-actuator, camel-observation-starter, micrometer, and zipkin:
<dependencies>
    <dependency>
        <groupId>org.springframework.boot</groupId>
        <artifactId>spring-boot-starter</artifactId>
        <version>3.5.11</version>
    </dependency>
    <dependency>
        <groupId>org.springframework.boot</groupId>
        <artifactId>spring-boot-starter-web</artifactId>
        <version>3.5.11</version>
    </dependency>
    <dependency>
        <groupId>org.apache.camel.springboot</groupId>
        <artifactId>camel-spring-boot-starter</artifactId>
        <version>4.18.0</version>
    </dependency>
    <dependency>
        <groupId>org.springframework.boot</groupId>
        <artifactId>spring-boot-starter-actuator</artifactId>
        <version>3.5.11</version>
    </dependency>
    <dependency>
        <groupId>org.springframework.boot</groupId>
        <artifactId>spring-boot-actuator-autoconfigure</artifactId>
        <version>3.5.11</version>
    </dependency>
    <dependency>
        <groupId>org.apache.camel.springboot</groupId>
        <artifactId>camel-observation-starter</artifactId>
        <version>4.18.0</version>
    </dependency>
    <dependency>
        <groupId>io.micrometer</groupId>
        <artifactId>micrometer-tracing</artifactId>
        <version>1.5.0</version>
    </dependency>
    <dependency>
        <groupId>io.micrometer</groupId>
        <artifactId>micrometer-tracing-bridge-brave</artifactId>
        <version>1.5.0</version>
    </dependency>
    <dependency>
        <groupId>io.zipkin.reporter2</groupId>
        <artifactId>zipkin-reporter-brave</artifactId>
    </dependency>
    <dependency>
        <groupId>io.micrometer</groupId>
        <artifactId>micrometer-registry-prometheus</artifactId>
        <version>1.5.0</version>
    </dependency>
    <dependency>
        <groupId>io.micrometer</groupId>
        <artifactId>micrometer-core</artifactId>
        <version>1.15.9</version>
    </dependency>
    <dependency>
        <groupId>ch.qos.logback</groupId>
        <artifactId>logback-core</artifactId>
        <version>1.5.32</version>
    </dependency>
    <dependency>
        <groupId>ch.qos.logback</groupId>
        <artifactId>logback-classic</artifactId>
        <version>1.5.32</version>
    </dependency>
    <dependency>
        <groupId>org.springframework.boot</groupId>
        <artifactId>spring-boot-starter-test</artifactId>
        <scope>test</scope>
    </dependency>
</dependencies>
For the Spring Boot variant, the application generates observations using Micrometer, which the micrometer-tracing-bridge-brave transforms to Brave spans. The zipkin-reporter-brave then sends the transformed spans to the Zipkin backend, which is Jaeger in our case. Finally, the spring-boot-actuator-autoconfigure dependency binds everything together by configuring and instantiating the components that send the spans to Jaeger.
2.2. Camel Standalone
Likewise, for the Camel Standalone application monitoring, we need camel-core, camel-main, camel-observability-services, and camel-opentelemetry2:
<dependency>
    <groupId>org.apache.camel</groupId>
    <artifactId>camel-core</artifactId>
    <version>4.17.0</version>
</dependency>
<dependency>
    <groupId>org.apache.camel</groupId>
    <artifactId>camel-main</artifactId>
    <version>4.17.0</version>
</dependency>
<dependency>
    <groupId>org.apache.camel</groupId>
    <artifactId>camel-observability-services</artifactId>
    <version>4.17.0</version>
</dependency>
<dependency>
    <groupId>org.apache.camel</groupId>
    <artifactId>camel-opentelemetry2</artifactId>
    <version>4.17.0</version>
</dependency>
<dependency>
    <groupId>ch.qos.logback</groupId>
    <artifactId>logback-classic</artifactId>
    <version>1.5.29</version>
    <scope>compile</scope>
</dependency>
In this version, the camel-observability-services dependency provides preconfigured components for exporting traces and health metrics. In the examples, we employ the OpenTelemetry Java agent to send the traces to Jaeger.
3. Application Under Monitoring
Now, let’s ensure we have a subject for the observations. To begin with, we create an application that reads XML files from a directory, processes them by adding the current timestamp, and copies them to another directory.
In a Camel application, Routes define how data is processed, and the RouteBuilder interface enables us to configure the application routes using Java-DSL. Before we create the RouteBuilder, let’s write the SimpleProcessor, which gets utilized by the RouteBuilder, and is identical for both application variants:
public class SimpleProcessor implements Processor {
    private static final DocumentBuilderFactory factory = DocumentBuilderFactory.newDefaultInstance();
    @Override
    public void process(Exchange exchange) throws Exception {
        String body = exchange.getMessage().getBody(String.class);
        String processedAt = LocalDateTime.now().toString();
        InputStream stream = new ByteArrayInputStream(body.getBytes(StandardCharsets.UTF_8));
        Document document = factory.newDocumentBuilder().parse(stream);
        Element root = document.getDocumentElement();
        Element newElemeent = document.createElement("processed");
        newElemeent.setTextContent(processedAt);
        root.appendChild(newElemeent);
        TransformerFactory transformerFactory = TransformerFactory.newInstance();
        Transformer transformer = transformerFactory.newTransformer();
        transformer.setOutputProperty(OutputKeys.INDENT, "yes");
        StringWriter stringWriter = new StringWriter();
        transformer.transform(new DOMSource(document), new StreamResult(stringWriter));
        String newBody = stringWriter.toString();
        exchange.getMessage().setBody(newBody);
    }
}
With the processor in place, it’s now time to write the RouteBuilder component, which is almost the same for both Spring Boot and Standalone applications, except for the dependency injection code. Moreover, the Spring Boot RouteBuilder, named SimpleRouteBuilder, uses the constructor injection approach:
public class SimpleRouteBuilder extends RouteBuilder {
    private final SimpleProcessor simpleProcessor;
    @Autowired
    public SimpleRouteBuilder(SimpleProcessor simpleProcessor) {
        this.simpleProcessor = simpleProcessor;
    }
    public void configure() {
        from("file://src/data?noop=true")
          .choice()
          .when(xpath("/person/city = 'London'"))
            .log("UK message")
            .to("file:target/messages/uk")
            .log("UK message 2")
            .process(simpleProcessor)
            .to("file:target/messages/general-sink")
          .otherwise()
            .log("Other message")
            .to("file:target/messages/others")
            .log("Other message 2")
            .process(simpleProcessor)
            .to("file:target/messages/general-sink");
    }
}
For the Standalone application RouteBuilder, we use the @BeanInject annotation, which injects a registered component from the Camel Registry:
public class SimpleRouteBuilder extends RouteBuilder {
    @BeanInject("SimpleProcessor")
    SimpleProcessor simpleProcessor;
// the rest of the file is the same as the Spring Boot SimpleRouteBuilder
Finally, we implement the application that combines all the moving parts. Let’s start by writing the @SpringBootApplication annotated main class:
@CamelObservation
@SpringBootApplication
public class CamelSpringBootApplication {
	public static void main(String[] args) {
            SpringApplication.run(FirstCamelSpringBootApplication.class, args);
	}
	@Bean
	SimpleProcessor simpleProcessor() {
	    return new SimpleProcessor();
	}
	@Bean
	SimpleRouteBuilder simpleRouteBuilder(SimpleProcessor simpleProcessor) {
	    return new SimpleRouteBuilder(simpleProcessor);
	}
}
The CamelSpringBootApplication is annotated with the @CamelObservation annotation and defines the required Spring beans. Additionally, the @CamelObservation annotation, which is included in the camel-observation-starter dependency, configures Micrometer Observation to generate metrics and traces for Camel routes.
Similarly, in the Standalone application that we called MainApp, we configure the Camel context using SimpleRouteBuilder and SimpleProcessor:
public class MainApp {
    public static void main(String... args) throws Exception {
        Main main = new Main();
        main.configure().addRoutesBuilder(new SimpleRouteBuilder());
        main.bind("SimpleProcessor", new SimpleProcessor());
        main.run(args);
    }
}
Furthermore, to execute the MainApp.main() method, we configure the camel-maven-plugin:
<plugin>
    <groupId>org.apache.camel</groupId>
    <artifactId>camel-maven-plugin</artifactId>
    <version>3.18.4</version>
    <configuration>
        <logClasspath>true</logClasspath>
        <mainClass>com.baeldung.camel.observability.MainApp</mainClass>
    </configuration>
</plugin>
Indeed, camel-maven-plugin enables us to start the Camel Standalone application by executing a simple mvn command:
mvn camel:run
Also, let’s enable opentelemetry2 components via config properties in the application.yml:
camel:
  opentelemetry2:
    enabled: true
    trace-processors: true
    trace-headers-inclusion: true
Lastly, to ensure that every application interaction gets reported, sampling probability needs tweaking as well:
management:
  tracing:
    sampling:
      probability: 1.0
On the other hand, the Standalone variant requires only the opentelemetry2 enablement:
camel.opentelemetry2.enabled=true
Thus, we should be ready for monitoring.
4. Monitoring Setup and Presentation
Conveniently, we monitor traces on the Jaeger server for both application variants.
4.1. Jaeger Deployment
Let’s deploy the Jaeger server as a Docker container:
docker run --name jaeger -p 16686:16686 -p 4317:4317 -p 4318:4318 -p 5778:5778 -p 9411:9411 cr.jaegertracing.io/jaegertracing/jaeger:2.15.0
This way, we can have a ready deployment without the hassle of manual setup.
4.2. Spring Boot
There are no additional steps needed for the Spring Boot application monitoring, so let’s start the application:
mvn spring-boot:run
Now, it’s time to navigate to Jaeger’s dashboard to find the traces. The dashboard URL is http://localhost:16686. To find the relevant traces, we use the application name as a service filter and file as the operation filter:
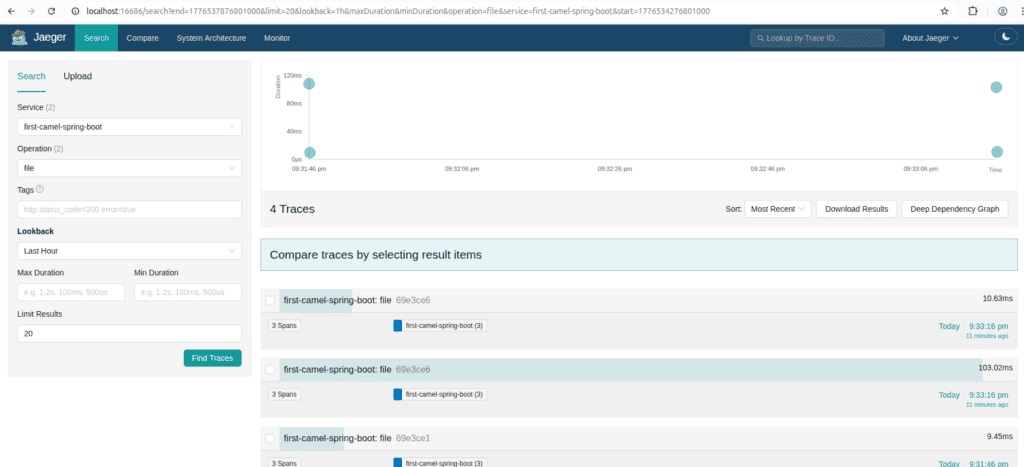
Subsequently, by clicking and expanding the first trace, we can inspect its contents in detail:
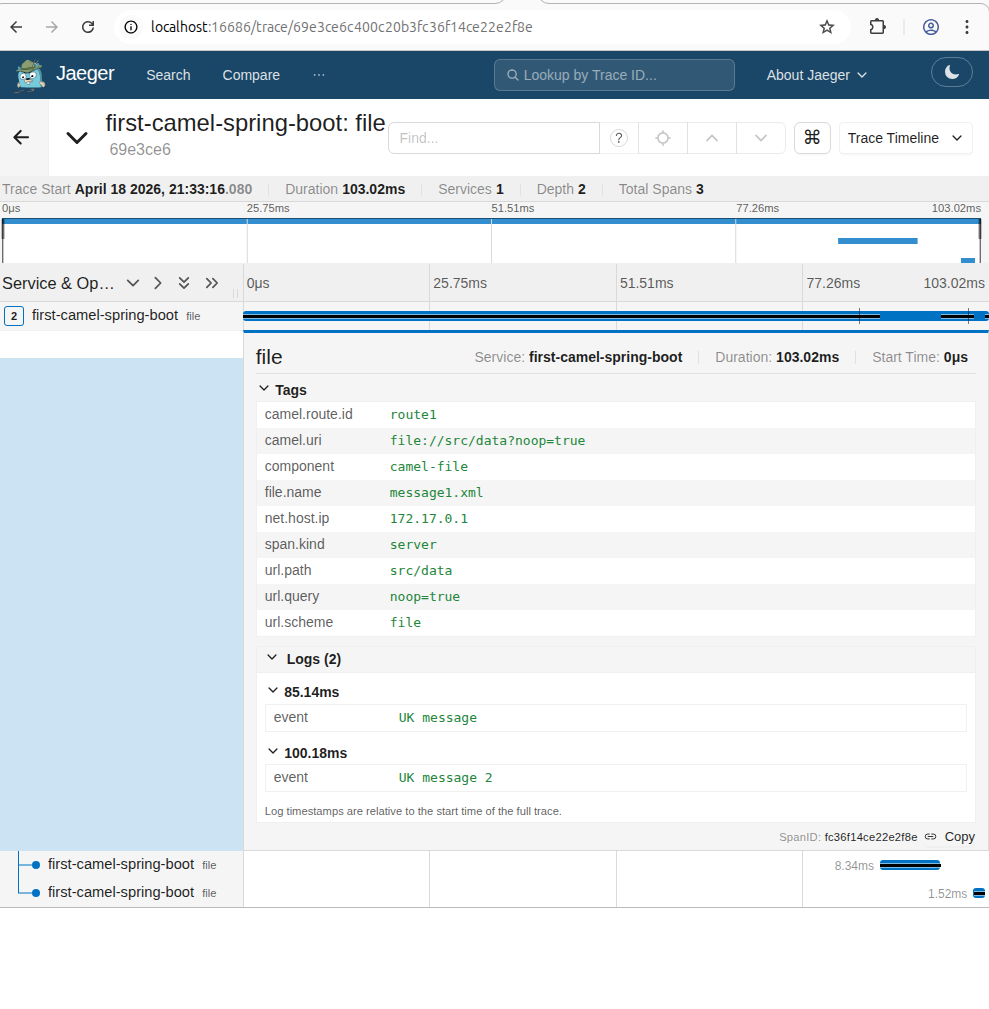
The nested spans contain the individual file operations:
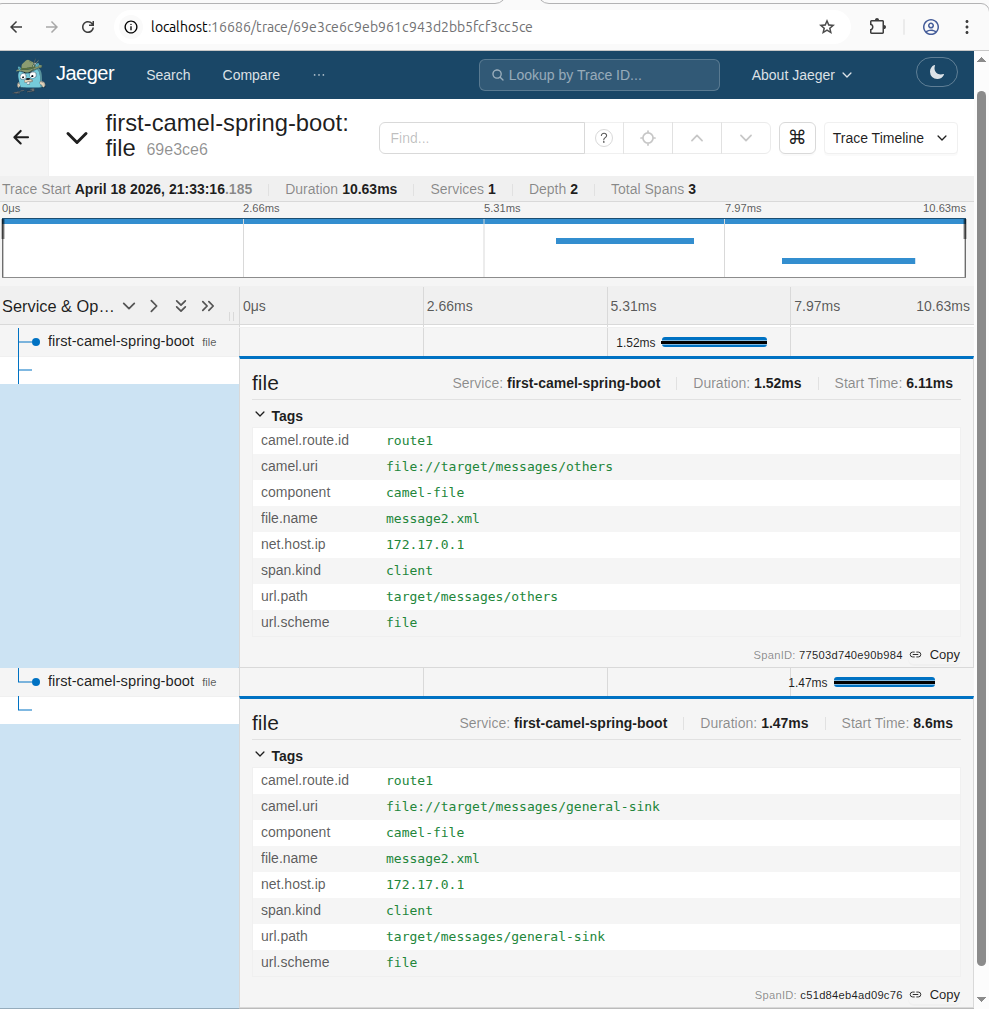
Once again, it’s important to mention that all this functionality is the out-of-the-box behavior of the dependencies we’ve used.
4.2. Standalone
To enable tracing for the Standalone application, let’s use a slightly different mvn command, so that the opentelemetry-java agent sends traces to Jaeger:
MAVEN_OPTS="-javaagent:path/to/opentelemetry-javaagent.jar -Dotel.service.name=camel-standalone" mvn camel:run
In the Jaeger dashboard, we use the Camel Standalone application name as a value for the service filter:
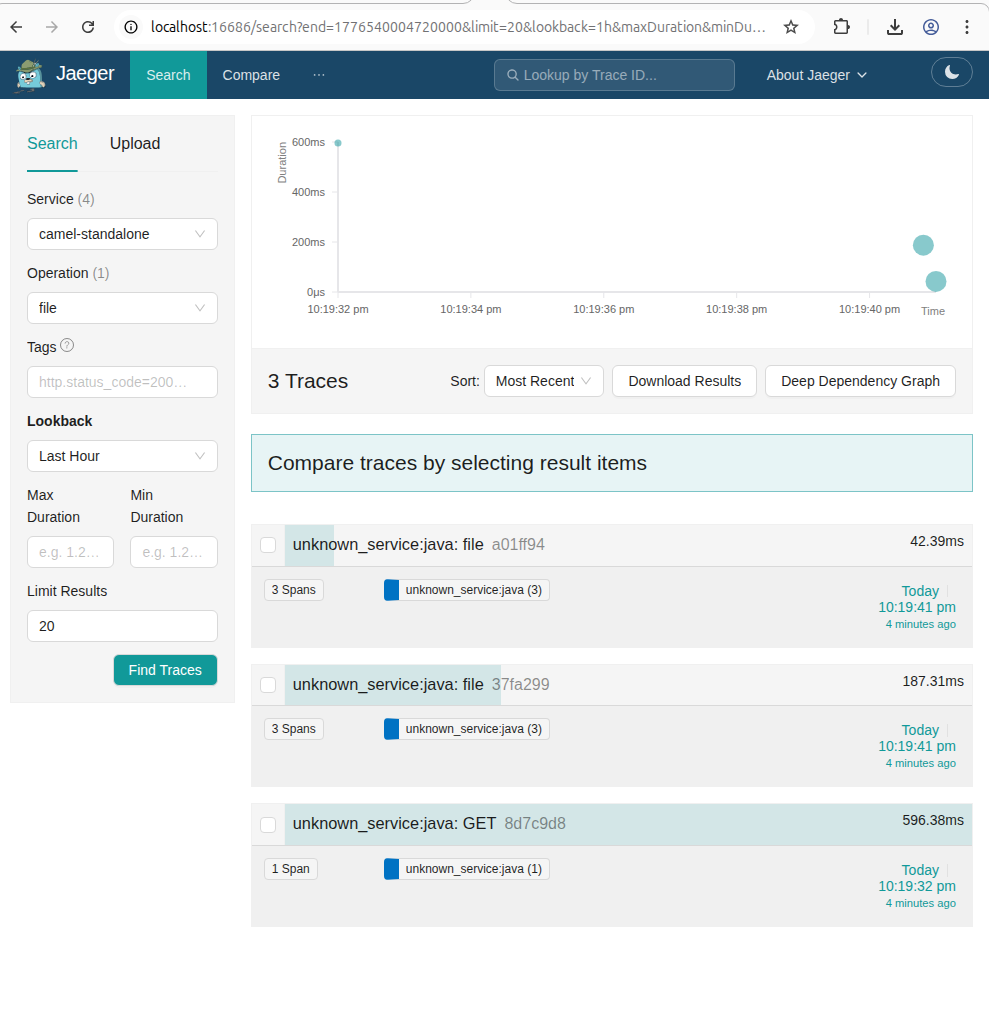
As expected, the span contents for the Camel Standalone application are no different from the Spring Boot application spans.
5. Conclusion
In this article, we demonstrated how to configure a Camel application to generate and send traces to a Jaeger server.
Specifically, we provided examples for both Spring Boot and Camel Standalone applications to ensure a good comparison between the two variants.
In summary, with the proper setup and regardless of the application architecture, using Apache Camel is a fairly straightforward way to monitor an application. The post A Guide to Camel Observability Services first appeared on Baeldung.
Content mobilized by FeedBlitz RSS Services, the premium FeedBurner alternative. | 


