The two point conversion has become more popular in National Football League (NFL) games, and it has become a popular topic of conversation in the NFL playoffs leading up to the Super Bowl. I once wrote a blog post that uses dynamic programming to identify when to go for 2 based on the score differential and the number of possessions remaining in the game. The analysis also shows what difference the choice makes, noting that most of the time the win probability does not make a huge difference in the outcome of the game, affecting the win probability by less than one-percent in most cases. In this post, I delve into the two point conversion, covering rule changes, football strategy, and assumptions.
By the numbers
In 2023, a typical NFL team attempted a two-point conversion about once 1 every 4 games and was successful just over half the time. A decade ago, a typical team attempted a two-point conversion about once 1 every 8 games and was successful just under half the time. Two point conversions became more popular and more successful. Two rule changes influenced these changes:
- In 2015, the NFL moved the extra point attempt from the 2 yard line to the 15 yard line.
- The proportion of extra points that succeeded lowered from 0.996 (in 2015) to 0.941 in the seasons after the change. A chart in an article on Axios illustrates how dramatic this change has been on extra point success rates.
- In 2023, a new rule allowed offenses to attempt a two point conversion from the 1 yard line (instead of the 2 yard line) when there was a defensive penalty on a touchdown.
- The proportion of two point conversions that succeeded increased from about 0.5 to 0.565, the first season the success rate was well-above 0.5.
The difference of one yard makes a difference. For comparison, attempts to go for it on fourth down and two yards to go succeed 57.2% of the time, and this increases to 65.5% for fourth down and one yard to go.
Decision-making
After a team scores a touchdown, they have essentially two choices. They can kick an extra point or they can attempt a two point conversion. The proportion of extra point attempts that were successful in 2023 was 0.96, and historically the proportion of two-point conversions that have been successful is 0.48. Therefore, on average, the extra point attempt or two-point conversion have promised roughly the same number of points on average.
The goal is not to maximize expected points, it’s to win the game. The two rule changes above have tipped decision-making in favor of the two point conversion in more situations by making the extra point attempt less attractive and the two point conversion more attractive.
The “best” choice for improving the chance of winning is situational and depends on a few factors:
- Point differential
- Time remaining (including time outs remaining)
- Strategies that each team may employ in the resulting situations
- Specific teams and match-ups
The dynamic programming model takes the first two factors into account, where the time remaining is modeled as the number of possessions remaining. Dynamic programming is an algorithmic approach that essentially enumerates the possible outcomes of the remaining drives in the game to quantitively determine the best options for the average team. This approach does not take specific situations into consideration, however, it is informative as a baseline.
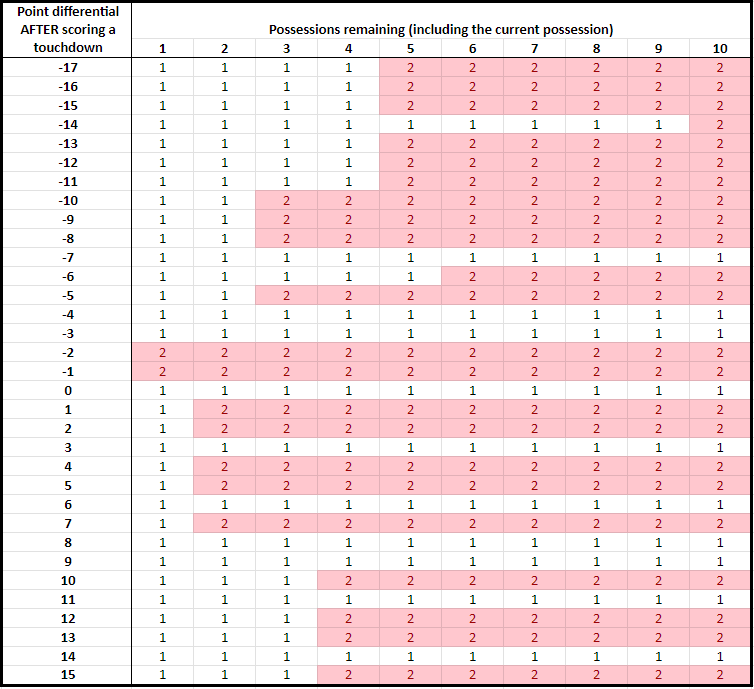
Using 2023 data, I present a chart of when the average team should attempt a two-point conversion based on the 2023 data. In this chart, pictured below, the rows capture the point differential when a touchdown is scored, with a negative score capturing how many points a team is behind. The columns capture how many possessions are remaining in the game, including the current possession. Therefore, as the game evolves, we move left in the table. The team with the final possession of the game has 1 possession remaining in the table, and a team with two possessions left will not get the ball back. Note that there are 22.2 total possessions per game, on average, so the last 6 possessions or so capture the fourth quarter.

According to this chart, an average team should attempt a two point conversion in many situations, including when a touchdown in the fourth quarter puts the team down by 8, 5, 2, or 1 or up by 1, 2, 4, 5, and 7. A team should not go for two when a touchdown puts the team down by 4 or 3, puts the team up by 3 or 6, or ties the game.
Compared to 2014–before the two rule changes mentioned above–two point conversations are now the better choice in more situations. For example, a two point conversation now is the better choice for the average team when a touchdown in the fourth quarter puts the team down by 1.
My analysis, as Prof. Ben Recht notes in an outstanding post on two point conversions, makes a number of assumptions. While some assumptions are more reasonable than others, the model still offers important insights that are not obvious before crunching the numbers.
A better way to decide whether to attempt a two point conversion
When I listen to broadcasts, I get frustrated with the analytics discourse from the commentators, which is often some version of “The analytics tell you to go for 2 in this situation.”
This is wrong. Analytics do not tell people what to do. Analytics are a collection of tools that can inform decision-making, with people making the final decisions.
If I were a football coach, I would not use the chart above. I would ask for a different chart based on the same analysis. Below, I create this chart.
No team is the average team. As noted earlier, the analysis using dynamic programming makes some assumptions that are not totally valid, including that an average team is facing an average team. The chart above always gives the same answer for the same point differential and possessions remaining, and it does not reflect other attributes of the situation at hand.
One specific situation that may affect the decision is the play that a team has available for the two point conversion. For example, historically 43.4% of pass plays have succeeded, whereas 61.7% of run plays have succeeded. Having a play in mind–and its associated likelihood of success–should affect the decision. Another situation is the team’s opponent, including their run and pass defense.
There are two ways to make the dynamic programming more informative for specific situations:
- Change the inputs to reflect the current match-up. In this case, one could change the probability that a two point conversion would be successful, the probability that an extra point is successful, the probability that a drive ends in a touchdown, and the probability that a drive ends in a field goal.
- Instead of only reporting the best decision (go for 1 or go for 2), the analysis can be used to report the probability that a two point conversion should be successful for it to be the better choice than attempting an extra point. In this case, a decision-maker (a football coach) can estimate how likely their play would success against the team they are playing in the specific situation they are facing.
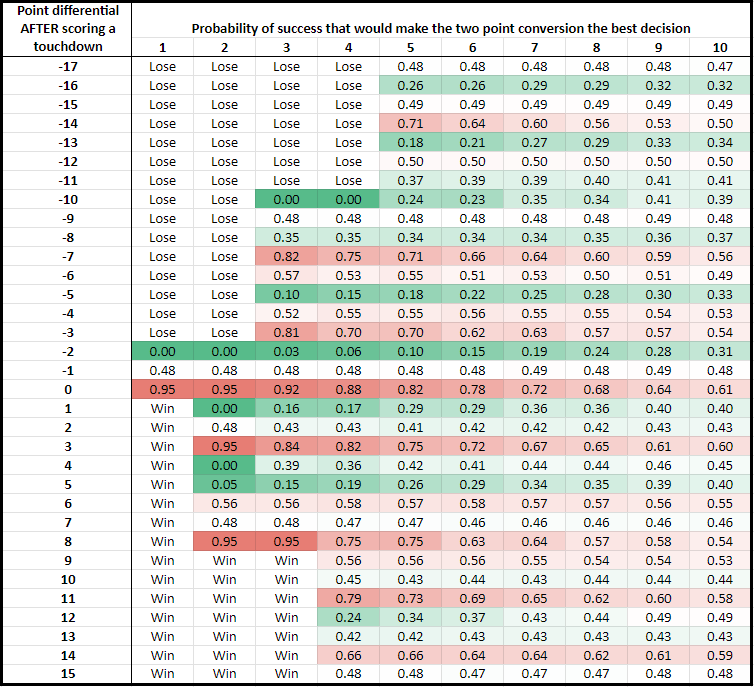
I illustrate the second approach below using the dynamic programming analysis above. Instead of reported the binary decision of going for 1 or 2 as before, I report the two point conversion probability of success above which going for two is the better decision. Again, I use data based on average teams. The lower the probability in the chart, the more attractive the two point conversion is.
Some decisions are clear cut. A 0.00 indicates that a team should always go for a two point conversion, and a 0.95 indicates that a team should essentially always attempt the extra point. Most of the probabilities are in between, which means that the “best” decision is not clear cut in most cases.

This new chart is more nuanced than the first chart in this post.
- Sometimes it is obvious to go for 2. A two point conversion is the better decision with a play that has a mere 25% probability of success when a touchdown in the fourth quarter puts the team down by 10, 5, or 2, or up by 1 or 5.
- Sometimes it is obvious to attempt an extra point. Going for two is the better decision with a play with a very high, 75% probability of success, which occurs when a touchdown puts a team down 7 or 3, up 3 or 8, or ties the game. Very few plays can expect a 75% probability of success, so in these situations it almost always is better to attempt the extra point.
Now consider strategies for two different teams:
- Team A with a two point conversion play with a 40% probability of success, and
- Team B with a two point conversion play with a 60% probability of success.
Team A and Team B would make different decisions if a touchdown in the fourth quarter puts them down by 9, 6, 4 or up by 3, 6, or 7.
Another insight: Both Team A and Team B should both attempt a two point conversion if a touchdown puts them down by 8.
Therefore, the same chart yields different “best” solutions for different teams based on the situations at hand. This insight follows directly from the numbers and the modeling, however, it is almost always overlooked in discussions on football analytics.
Related articles and posts:
- When to go for a two point conversion instead of an extra point: a dynamic programming approach (Punk Rock Operations Research)
- The rise of the two point conversion from The Upshot at the New York Times
- When to go for 2, for real from FiveThirtyEight
- Should you go for 2 when down 8? An analysis by Ben Recht
- Should a football team run or pass? A game theory and linear programming approach (Punk Rock Operations Research)


Leave a comment