Kicking the can down the road is the new national pastime. Every time the government’s bills come due, officials at the Treasury Department find creative ways of paying them with money they don’t have.
One measure of just how overextended the United States has become financially is the debt-to-GDP ratio. For most of the country’s history, excluding temporary wartime blips, net general government debt tended to be less than 50% of the economy.
As recently as the early 1970s, debt as a percentage of GDP came in at under 25%. By the early 1980s, it grew to over 30% and fiscal hawks became concerned. In the 1990s, it climbed to over 40% and concern started morphing into alarm.
Last year, the U.S. official debt-to-GDP ratio topped 100% (1:1). In other words, taxpayers owe more than the value of everything they produce.
That spells doom for most countries. The International Monetary Fund issues dire warnings to Third World countries whenever they exceed a threshold of 70% of GDP.
The U.S. is different, apparently, thanks to the status afforded to the Federal Reserve Note as a world reserve currency. Up until 1971, that status was backed by a promise to redeem dollars held by foreign governments in gold.
Gold also served to restrain spending and borrowing at the federal level.
But ever since President Richard Nixon rescinded gold redeemability, politicians have been given the green light to run up debt without limit.
If the Joe Biden White House gets all its spending proposals pushed through, an additional $9 trillion will be added to the national debt. Barring a miraculous corresponding surge in GDP, the debt ratio can be expected to continue trending in the wrong direction.
How long officials in Washington can keep kicking the can down the road before kicking it off a cliff is unknown. These are, after all, unprecedented times in which the “lender of last resort” Federal Reserve has virtually unlimited powers.
But the central bank can’t bail out Uncle Sam perpetually without unintended consequences. Staving off a debt crisis may mean triggering a currency crisis.
Gold Is Poised to Outperform the Stock Market
During major financial crises in history, gold has vastly outperformed paper assets.
For example, both the deflationary Great Depression and the inflationary late 1970s saw the gold price reach a 1:1 ratio versus the Dow Jones Industrial Average.
The Dow trades at over 35,000 today, about 20 times the gold price.
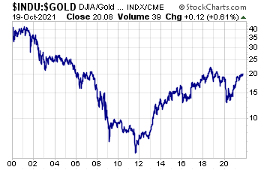
Dow:gold ratio, 2000-present.
Were the Dow:gold ratio to revert toward 1:1, either stock would have to crash, gold would have to launch into a super-spike or some combination of both.
Given the tremendous inflation pressures currently exerting themselves in the economy, the late 1970s may be the best model for what to expect going forward.
It would mean rising price levels combined with a weak economy (stagflation).
And given that our debt load today is more than four times greater as a share of the economy than it was in the 1970s, investors should brace for the potential of a far greater financial crisis.
If plays out in the form of a crash in the value of the U.S. dollar, gold will serve as a premier safe-haven asset.
Silver Is Poised to Outperform Gold
But silver could perform even better as an inflation hedge. It did during the late 1970s leading up to its January 1980 super-spike high of nearly $50/oz.
Some dismiss that move as artificially induced by the Hunt brothers, who tried to corner the silver market. They shouldn’t dismiss the potential for another mad scramble for scarce supplies of silver, however, fueled by broad and deep global demand rather than a handful of futures market speculators.
This time around it could be Tesla or a solar panel manufacturer, for example, that tries to “corner” the silver market by accumulating strategic stockpiles.
Or it could be large numbers of individual investors mobilized in internet forums to collectively “corner” the market for physical silver. Crowdsourced campaigns spearheaded by silver enthusiasts are already afoot to try to force the hand of paper futures traders who engage in naked short selling that artificially suppresses spot prices.
For now, silver remains relatively cheap versus not only most financial assets but also other hard assets. In March 2020, silver became historically cheap versus gold – at one point sending the gold:silver price ratio to a record 130:1.
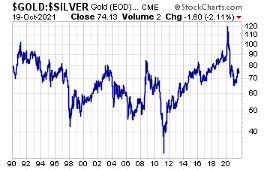
Gold:silver ratio, 1990-present.
The gold:silver ratio currently checks in at about 76:1. It still has a lot more room to narrow in favor of silver during a precious metals bull market.
At the 1980 peak, the ratio came close to hitting 16:1, which is often referred to as the “classic ratio” observed going back to ancient times.
Meanwhile, the current mining ratio is only about 7:1, according to First Majestic Silver CEO Keith Neumeyer. That is to say, mines worldwide are producing 7 ounces of silver for every ounce of gold they bring to market.
With so many ratios seemingly out of whack, investors would be wise to reconsider the ratio of hard assets to paper assets in their portfolios. And those who already have a prudent allocation to gold bullion should be sure they also have an adequate ratio of silver holdings.

About the Author:
Stefan Gleason is CEO of Money Metals Exchange, the company recently named "Best Overall Online Precious Metals Dealer" by Investopedia. A graduate of the University of Florida, Gleason is a seasoned business leader, investor, political strategist, and grassroots activist. Gleason has frequently appeared on national television networks such as CNN, FoxNews, and CNBC and in hundreds of publications such as the Wall Street Journal, TheStreet, and Seeking Alpha.
