Last year, I tweeted about a win probability model I created for soccer (or football, depending on where you are from) and the 2019 FIFA Women’s World Cup case study. I promised to blog about this case study I developed for my probability models course. This is a long overdue blog post on this topic.
Here is a portion of the soccer analytics case study.
Soccer win probability model
Soccer (or football, which it is called outside of the the United States) is based on a 90 minute match. The data from FIFA women’s soccer indicate:
- Home teams score 2.34 goals/match (in regulation)
- Visiting away teams score 1.71 goals/match (in regulation)
We assume the goals are scored according to a Poisson process with exponentially distributed arrival times. Assume each team scores independently of one another and of the score. We can use the home team data for the team that is favored in the match.
Consider the situation when the home team is down by 1 goal with 4 minutes in regulation. Find the probability that the home team wins. This is a win probability. We do not consider pulling the goalie.
In one possible solution, we divide the match into small increments of, say, a half minute in length. We recursively solve for the home team’s win probability for any score differential and any time. This way, we want to be able to answer questions like this repeatedly for different score differentials and lengths of remaining time.
The derivation is next. You can skip the math if you want and jump to the figures below.
Let the random variable capture the event that the home team wins with a score differential of
with
increments to go.
We want to find , the probability that the home team wins if there is a score differential of
with
increments to go. In our problem, the home team is down by 1 goal with 4 minutes in regulation, yielding
for a win probability with a score differential of -1 with eight 30 second increments to go.
We use a recursive expression to compute the probability of scoring in small intervals of time and put the solution in a spreadsheet. The spreadsheet approach computes our solution, and it allows us to assess a variety of situations, including different score differentials with different amounts of time to go. The boundary conditions with 0 time increments to go are if
(the home team is winning when time expires),
if
(the home team is losing when time expires), or
if
(the match ends in a tie).
There are two ways to compute the probability that a team scores in a small amount of time , which is the length of an increment: (1) we can use exponential interarrival times, or (2) we can use the Binomial approximation. I’ll illustrate the latter approach below. We have to make the time increments small enough such that having at most one goal scored during the time interval is a reasonable assumption.
We compute by conditioning on 𝑌, where 𝑌 captures what happened in increment 𝑖 with a home goal (+1), an away goal (-1), or no goals (0):
After taking advantage of independent increments, we can simplify this to . Here, we recursively solve for
by conditioning on what happened last and formulating a new expression based on the win probability with
time increments to go.
Here, , where
home goals per match. Likewise,
, where
visiting team goals per match.
Let’s look at the answer
We can put this into the spreadsheet and estimate the probability of 0.048 that the home team wins when down by 1 goal with 4 minutes to go. We can see answers to other scenarios. A home team wins with a probability of 0.517 if the match is tied with 5 minutes to go.
What is more interesting is that we can move across these spreadsheet to estimate real-time win probabilities. Every time there is a goal, we jump to another row in the spreadsheet. We jump up a row if the visiting team scores and down a row if the home team scores.
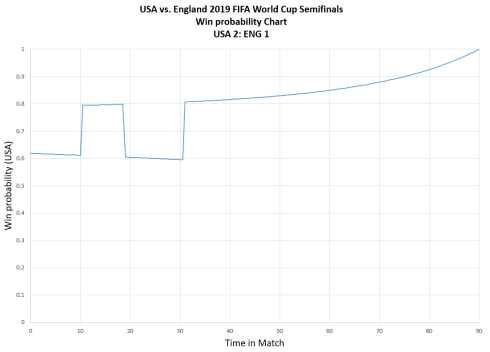
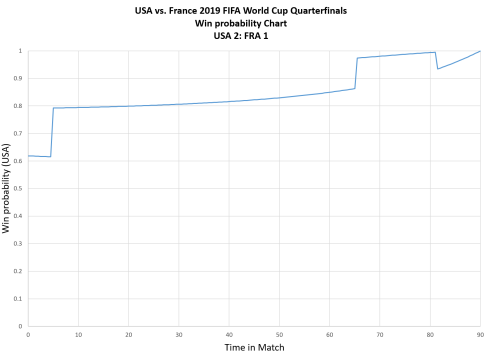
I made two win probability charts for the USA v ENG and USA v FRA games in the 2019 World Cup. I set the USA Women’s National Team as the “home” team since they were favored to win in each of the matches, even though the matches were played in France. You can also see that the home team has a probability of 0.61 of winning when the game begins.
Earlier we assumed that goals are scored according to a Poisson Process. Is that a good assumption? Not exactly (see this post using Premier League data) but it’s not a bad approximation except for the end of game situation when a team pulls their goalie. The model we built above can be easily changed to have time-specific scoring rates. Pulling a goalie is trickier but doable. When pulling a goalie, we have to consider new Poisson scoring rates that depend on time and the score differential.
On a side note, the Poisson process assumption holds up better with National Hockey League data.
https://twitter.com/lauraalbertphd/status/1197640721437777924


July 2nd, 2020 at 10:18 am
Very nice probability model for soccer. How did you change the conditional probability P(W|Y) into P(W(d+y)?
Also I think there is problem with your last LaTEX expression.
Thanks and stay safe.
Luis
July 2nd, 2020 at 10:37 am
Thanks, Luis!
>> How did you change the conditional probability P(W|Y) into P(W(d+y)?
This is the recursion, which works due to independence. We can use the information about whether a goal was scored in the last increment contained in the random variable Y to change the score differential in W with i-1 increments. We have to account for a difference in the score–and that associated probability–between time increments.
I fixed the LaTeX expression. The editor seems to be fragile on WordPress. Thanks a:)