There’s been a hidden decline in the global gold mining industry unrecognized by most investors. It’s an insidious and mysterious decay that has plagued the industry for many years. Unfortunately, investors can’t see what’s occurring in the gold mining industry because they are unable to notice the subtle changes taking place over decades as the market is focused on quarterly results.
Thus, the adage…. the frogs are slowly cooked to death, fits here perfectly.
However, we really can’t blame investors as they have been trained to look at short-term results rather than the longer-term fundamental trends. Furthermore, the overwhelming majority of investors don’t read the gold companies’ financial reports, and I would bet that only a small handful go back more than a few years.
I am probably one of the few crazy people out there who enjoy reading over gold company annual reports that were published 20-30+ years ago. While most individuals may find this type of detailed research boring as hell, I am quite fascinated. And the information in this article will reveal an industry that is being devasted by the slow and agonizing impacts of the Falling EROI – Energy Returned On Investment.
For those new to reading my work, simply put, the Falling EROI is nothing more than the decline in vital net energy for the global economy. The United States was producing oil in the 1930s at a staggering 100/1 EROI. Thus, the oil industry delivered 100 barrels of oil to the market for the energy cost of one barrel. By 1970, this fell to 30/1, and today; the U.S. Shale Oil Ponzi Scheme is producing oil at less than 5/1 EROI.
Please don’t confuse oil profits with falling net energy. While declining net energy results in falling profits for the oil industry, the worst impact is that it will eventually bankrupt the global economy. More on that in future articles.
The Falling EROI has had a direct impact on the gold mining industry, especially since the 1970s. By looking at the data from the gold mining companies’ annual reports, we can see how the investor has “unknowingly,” been sacrificed to keep the gold mining industry afloat.
To understand how the gold mining industry has declined, we need to take a look at how capital investment has changed over the past 50 years.
As The Falling EROI Declines, Gold Capital Expenditures Surge
There is an interesting relationship between the Falling EROI and the increase in capital expenditures in the gold mining industry. For example, Homestake Mining, the largest gold mine in the United States in the 1970s, invested only 6% on capital expenditures (CAPEX) versus their total revenues in 1979:
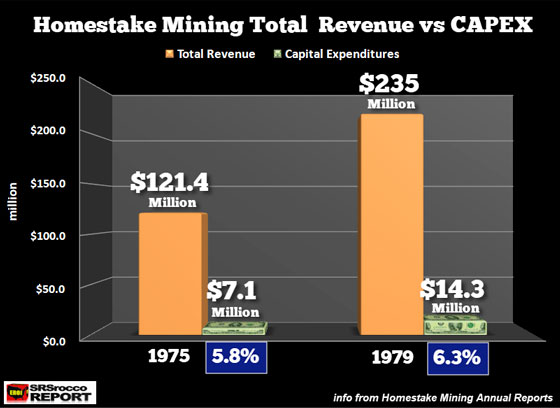
In 1979, Homestake spent $14.3 million on CAPEX compared to the $235 million in total revenues. While this was one of their best years, due to the very high gold price, we can see that in 1975, with a much lower gold price, the CAPEX percentage to total revenues was only 5.8%. So, this ratio didn’t change that much as the gold price shot up to new highs.
However, if we compare the peak years of Homestake Mining in 1978-1979 (I did not have 1980 data), to that of the top three gold miners peak in 2011-2012, the evidence points to a huge increase in CAPEX spending to total revenues:
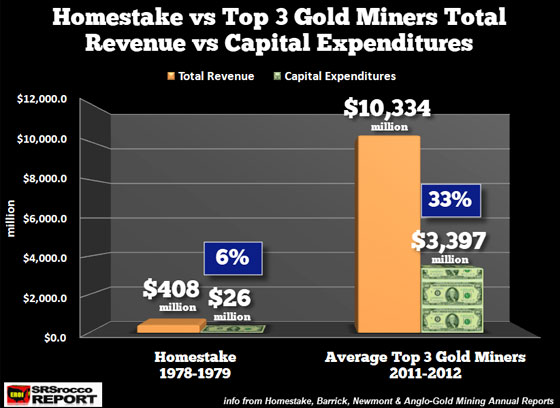
What a difference, ah? While Homestake was only investing 6% of its total revenues on CAPEX in 1978-1979, Barrick, Newmont, and AngloGold during 2011-2012 forked out 33%, or one-third of its total revenues on CAPEX spending. Thus, the top three gold miners spent more than five times the CAPEX per revenue ratio than Homestake Mining during the peak gold price years.
The reason is simple. As the gold mining industry transitioned from underground to open-pit mining to increase production, ore grades fell, and this how a dramatic impact on the cost of doing business. Not only did CAPEX spending skyrocket, but so did costs all across the board.
To simplify the chart above, I took the total revenues for Barrick, Newmont, and AngloGold for 2011 and 2012 and came up with an average of $10.3 billion ($10,344 million) for those two years. I then calculated an average of their total CAPEX spending of $3.4 billion, which equaled 33% of the companies’ total revenues.
Now, while it is true that Barrick made some lousy investments and wasted a lot of investor money on projects that didn’t pan out, Pascua Lama, for instance, I found that the average CAPEX to total revenues for the entire decade of 2009-2018 for these top three gold miners was 25%. Either way, you look at it, the gold mining industry's CAPEX spending per total revenue quadrupled since the late 1970s.
However, a troubling sign has emerged over the past few years as the gold miners have decided to cut back on capital expenditures to increase cash flow to make their shareholders happy. According to my calculations, the top three gold miners' CAPEX to total revenues in 2018 was only 18%. Thus, the falling percentage of CAPEX spending will not allow these gold miners to increase or replace production in the future.
How The Gold Mining Industry Sacrificed Their Shareholders To Continue Business As Usual
I will provide two charts below that show how the gold mining industry sacrificed its shareholders to fund the business model and increase production. The first chart hits the gold mining investor right between the eyes. If you were a gold investor in Homestake back in 1978, it only took 34 shares of the company stock to produce one ounce of gold. However, twenty years later in 1998, that amount increased to 52 shares per oz of gold production in the top three gold miners:
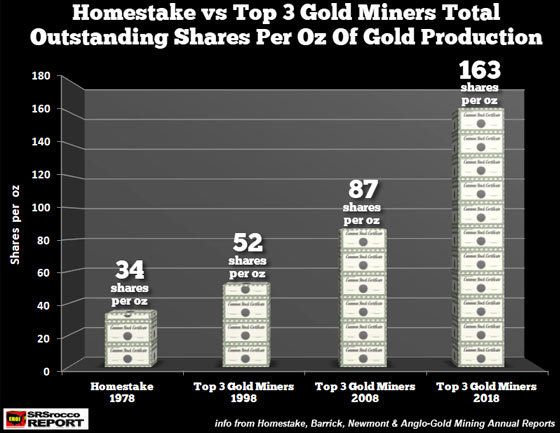
As we can see, the company shares per ounce continued to rise to 87 in 2008 and then nearly doubled to 163 in 2018. While some of these companies instituted stock splits, the majority took place before 1997 and didn’t impact the figures above all that much. Regardless, the gold mining industry resorted to diluting shares to fund operations and grow production. Unfortunately, even with the increased CAPEX spending and share dilution, production at the top three gold miners has declined by nearly 4 million oz since 2012.
Top 3 Gold Miners Production 2012 = 16.9 Million oz
Top 3 Gold Miners Production 2018 = 13.0 Million oz (23% decline)
While gold mining investors have been negatively impacted by share dilution, this is only one part of the unhappy story. If we consider the dividend payouts to investors, the next chart puts the icing on the cake:
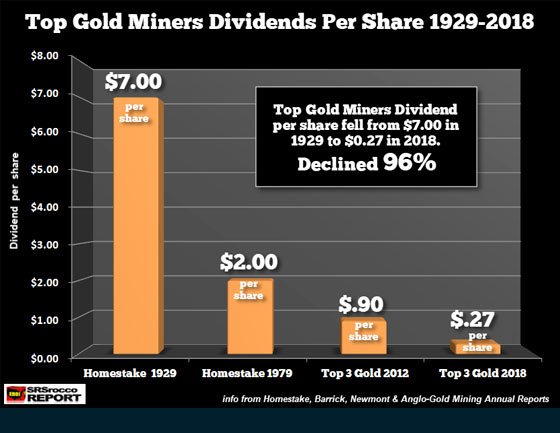
If we go back to 1929, an investor in Homestake Mining enjoyed a whopping $7 a share dividend. So for every share you owned, you received $7. While the dividend Homestake paid fell to $2 a share in 1979, it was more than double the average $0.90 per share paid by the top three gold mining companies to investors at the peak in 2012. Unfortunately, things aren’t doing that well for the gold mining industry as the average dividend per share fell to $0.27 last year.
Of course, if the gold mining industry is going to dilute shares, then even if it paid the same total dollar amount in dividends, the price per share would fall. But, there is one shining bright spot in the bunch, and that is Newmont Mining. Newmont paid the highest amount of dividends per share at $0.56 in 2018. We can thank Newmont for bringing up the average of the group to $0.27 last year. Here are the dividends per share for each of the top 3 gold miners:
Newmont 2018 Dividend per share = $0.56
Barrick 2018 Dividend per share = $0.19
AngloGold 2018 Dividend per share = $0.06
As we can see, AngloGold has the lowest dividend per share at a measly 6 cents. Moreover, Newmont’s gold production has held up the best in the group since 2012 as it has only fallen 7% versus a 13% drop for AngloGold and a stunning 40% cliff-dive for Barrick.
If we look over the data in this article, there has been a hidden decline in the gold mining industry over the past several decades. Due to the Falling EROI, it now takes a great deal more capital expenditures to produce gold than it did 40-50 years ago. Thus, the gold mining industry has sacrificed the investor-shareholder to fund business and grow production.
However, the massive amount of CAPEX spending by the top gold miners that took place during the peak price years hasn’t increased production, or at least, keep it stabilized. As I mentioned, the gold mine supply from the top three has declined by nearly 4 million oz since 2012, with the most coming from Barrick.
Unfortunately for investors, they can’t see what’s happening in the gold mining industry because they are mostly focused on short-term results. While a substantial increase in the gold price will push the gold mining shares up significantly, it’s been a difficult road for investors as the industry has been negatively impacted by the Falling EROI.
The insidious decline of the gold mining industry (and the global economy), due to the Falling EROI, is something not discussed by analysts or investors. There tends to be this notion that growth will continue forever, as well as business cycles. For example, one of the solutions to the massive debt in the system is to back the Dollar and global currencies with gold. While this sounds like a viable solution, it doesn’t consider the most important factor… ENERGY.

About the Author:
Independent researcher Steve St. Angelo started to invest in precious metals in 2002. In 2008, he began researching areas of the gold and silver market that the majority of the precious metal analyst community has left unexplored. These areas include how energy and the falling EROI – Energy Returned On Invested – stand to impact the mining industry, precious metals, paper assets, and the overall economy.
