


Over the past six years, the biotech sector has experienced an incredible run of IPOs, reflecting the longest and largest “open window” for new offerings.
Much has been written about post-IPO performance here and elsewhere, but there’s been little discussion about equity sales by executive teams following these IPOs.
In many ways, it’s a taboo subject, raising questions like “does a CEO who sells some of their stock signal a lack of conviction”? Insider sales/purchases are commonly tracked by public market investors seeking to understand internal sentiment changes.
But given the typical equity holdings of most senior biotech executives, much of their net worth is often locked up in these positions. And as any financial planner will tell you, when the vast majority of your net worth is in one security, taking some steps to even modestly diversify is often smart and prudent. As an example, having a 401K entirely in a single company’s stock, a common feature in the past, has long been debunked as a bad idea. Executives with large equity positions and net worth concentrations should be thoughtful about this from a wealth management perspective.
But since no one really talks about it, how is one to know what’s the right approach?
Here are a few thoughts on the peer benchmarking data around CEO stock sales to ground the discussion, as well as some general guidelines that balance implicit messages to the market with appropriate wealth management and financial planning.
First, let’s start with the data.
Private wealth advisors Bjorn Koch and David Cairone of UBS Financial Services, who run a life sciences focused wealth management practice, have assembled one of the largest datasets on CEO stock sales in the recent IPO period. They analyzed 219 life science companies that went public from 2012 through 2018 and have moved out of their initial lock-up periods (180-days post-IPO typically).
Importantly, only a minority of the CEOs have sold any stock at all: of these 219, 83 companies (38%) had a CEO sell company stock at least one time following their IPO. Much of the following analyses are on these 83 and the context (stock price, market cap) of the company during the years they sold any stock. It’s also worth noting that it’s believed the vast majority (90%) of these stock sales were done via 10b5-1 plans (more on that later).
For those that sold some of their equity, the median amount sold in a single calendar year has been 5% of their total ownership (9% average). At these paces, it would take a CEO 10-20 years to sell their initial IPO equity positions. Not to mention the fact that annual stock grants are a common part of CEO compensation and retention/incentive packages. These are very modest overall sales (which occur in the minority of companies, as noted above).
The total amount of stock sold (if at all) is highly dependent on the underlying post-IPO stock performance, as you would expect (and in alignment with investor interests). Here’s a chart that captures the median and average stock sales – of those who sold at least once – as a percentage of their holdings in that initial year. Simple message: if the stock does well post-IPO, it’s typical practice to sell 4-6% of your equity holdings as a CEO (at the median).
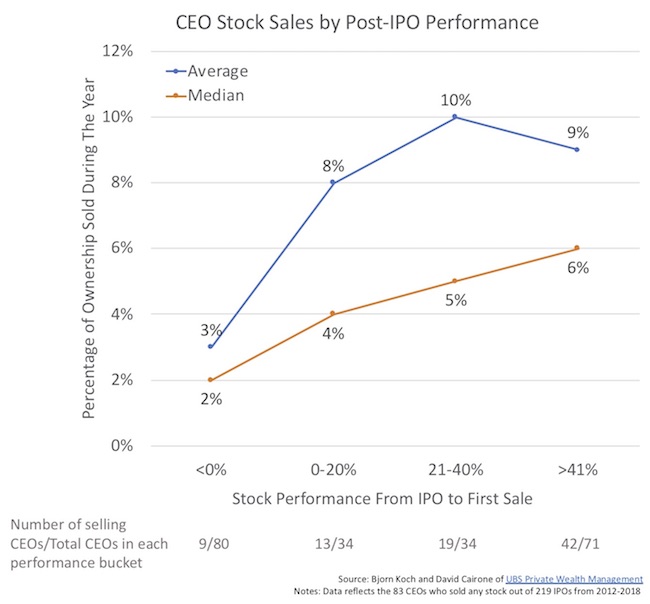
Around 55-60% of the CEOs of companies whose stock price has gone up over 20% following their IPOs have sold some stock, which means even a good portion of these high performers have yet to sell anything. Only ~11% of the CEOs whose stock has broken IPO issue price have sold.
The median and average returns of companies where the CEO was a seller, from IPO price through December 31, 2018, are 12% and 60%, respectively. For those CEOs that didn’t sell anything, the median and average post-IPO performance are -50% and -16%, respectively. Bottom line, as expected, is that strong stock performance creates the opportunity for (modest) stock sales.
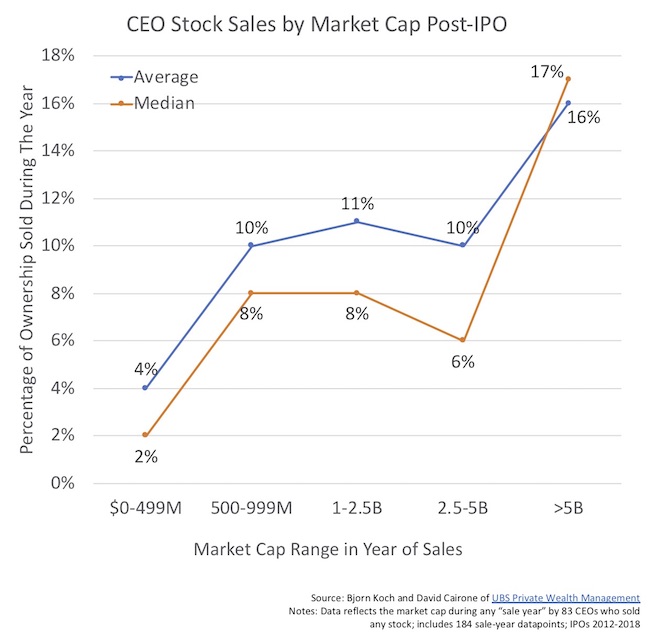
As you might expect, CEO stock sales (when they occur) generally increase with underlying market capitalization, with large increases after the company breaks the $5B mark (caveat: only 4 data points above $5B) and almost no annual sales below $500M. The curve is relatively flat in the middle ($500-$5B) where companies are typically deemed to be performing well.
The timing of the initial CEO sales is also interesting to examine: the median and average time from IPO to first sale was 364 days and 502 days – a full year to 18 months after the IPO. These timelines reflect long-term wealth management plans.
After the first sale, there are often questions of how frequently an executive should have a planned sale trigger, especially since public Form 4 filings need to be made with each sale. When UBS examined the 2018 sellers (56 CEOs), they sold an average of 6 times. No real differences in stock performance were discernable for those that sold more or less frequently.
Volume restrictions, given the low liquidity of most biotech stocks, are often real and need to be considered. The average post-IPO stock in 2016-2017 traded roughly 80-100K shares a day. Post-lockup expiry, the average daily trading volume moves up by 25-50% in the month or so thereafter. But these are still thinly-traded stocks – so put a significant constraint of the volume of any given 10b5-1 planned sale. An executive’s stock sales should aim to never be big enough to move the stock downward.
Exploring the 136 CEOs who haven’t sold any stock, the majority (52%) of those companies broke issue before the lockup expiration. Selling stock as a CEO in a broken IPO is generally bad form. However, 21% of these no-sale-CEOs were trading very well (>40% post-IPO at lockup expiration). There are many reasons why these CEOs decided not to sell: didn’t have a 10b5-1 selling plan in place, financial advisor advice, different net worth considerations, expectations about future performance, or worries about investor optics before future value inflections.
So, if you are a CEO and want to be in-line with your peer group, here are a few guidelines that emerge from looking at the data:
- Don’t sell anything below the IPO price, at least for several years following an IPO. This sends a bad message to the Street.
- If you choose to sell, do so via a 10b5-1 plan.
- With that plan in place, structure it so that only 6-10% of your total equity position is sold in any given year. With evergreen stock option programs pegged at roughly 4% annually, the net equity change for most CEOs would be in the 2-4% range.
- Don’t sell more shares than the daily trading volume can handle: old rule of thumb is that any planned executive sale should never be more than 15-20% of the daily volume.
- If you plan to sell, do a small amount more frequently rather than in larger blocks: e.g., ~6 times a year to capture the upside volatility and dollar-cost-average your sales over time.
These are just guidelines. Company-specific context can change these significantly, so take them for what they are worth. In addition, these guidelines hold for most other key C-level executives and founders as well. These data can also be used to adequately respond in a fact-based manner to any potentially negative investor scrutiny around an executive’s equity sale plans.
Further, as an investor and shareholder in many of these companies, I’d strongly recommend having your entire senior management team work with the same financial advisor to create a strategic approach, guided by these benchmarks, to manage this equity and wealth management process carefully. Having every C-level executive with their own uncoordinated plan isn’t helpful at all. And, like the benefit of a high volume surgeon, it should certainly be done with a financial advisor who does a lot of 10b5-1 planning (and preferably with a team who has experience in biotech given the unique nature/ high volatility of the sector)..
As a final thought, don’t get too cute with your plan or spend too much time fretting over it, even in volatile moments like 4Q 2018. Set some price and volume targets, and a frequency, and then forget about it – so that you can focus on creating value at your company.
Thanks for David and Bjorn for sharing their data. For a deeper dive into their dataset, feel free to reach out to them here.