
One of the major topics discussed in the precious metals community is the manipulation of gold and silver prices by large bullion banks. Many precious metals analysts point to the massive commercial short positions held by JP Morgan and Scotiabank as the root cause for the low silver price. While I agree that the bullion banks’ massive short contracts are controlling the silver price to a certain degree, there’s another factor that is overlooked by the majority of precious metals analysts.
According to Ed Steers’ recent article titled, JPMorgan’s Silver Short Position Now At 195 Million Ounces, he stated the following:
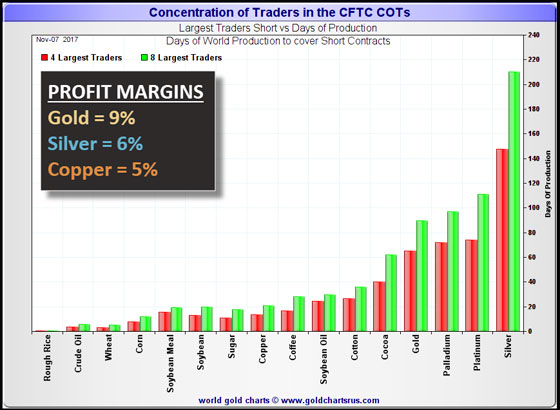
For the current reporting week, the Big 4 are short 148 days of world silver production-and the ‘5 through 8’ large traders are short an additional 62 days of world silver production-for a total of 210 days, which is seven months of world silver production, or about 510.3 million troy ounces of paper silver held short by the Big 8. [In the COT Report last week, the Big 8 were short 203 days of world silver production.]
As I also stated in the above COT Report, Ted pegs JPMorgan’s short position at about 39,000 contracts, or around 195 million troy ounces, which is up about 35 million troy ounces from what they were short in last week’s COT Report. 195 million ounces works out to around 80 days of world silver production that JPMorgan is short. That’s compared to the 210 days that the Big 8 are short in total. JPM is short about 38 percent of the entire short position held by the Big 8 traders.
The two largest silver shorts on Planet Earth-JP Morgan and Canada’s Scotiabank-are short about 111 days of world silver production between the two of them and that 111 days represents 75 percent of the length of the red bar in silver in the above chart... three-quarters of it. The other two traders in the Big 4 category are short, on average, about 18.5 days of world silver production apiece, which is unchanged from last week — and the prior week. The four traders in the ‘5 through 8’ category are short, on average... 15.5 days of world silver production each, which is up a hair from last week’s COT Report.
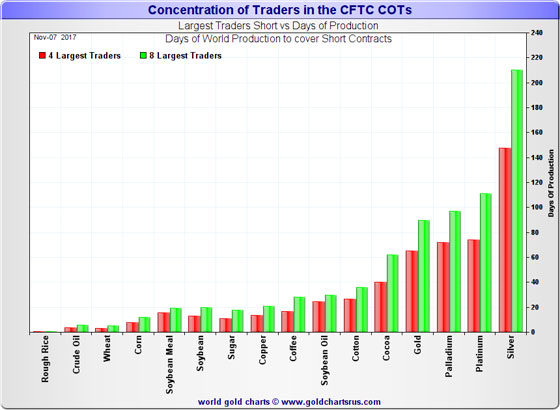
Ed Steer is making the point that two banks, JP Morgan and Scotiabank control approximately 53% of the 210 days worth of global silver production to cover these short positions. If we look at the chart above, we can clearly see that silver has the highest amount of short positions in days of production compared to any other metal or commodity.
Furthermore, Ted Butler, a well-known silver analyst, made the following remarks in his recent article, Life Under Manipulation:
We as individuals have little or no control over the state of markets, all we can do is adapt to market realities. In the case of silver, the reality is that it is in the grip of a price manipulation. History shows that various world governments have often artificially set the price of silver and gold in connection with official monetary policies. However, for the past 35 years, a specific type of price manipulation has existed in silver via futures contract positioning on the Commodities Exchange, Inc. (COMEX).
Nothing can be more significant than the fact that silver is manipulated. Whether to participate in a manipulated market is something everyone must decide. To me, the choice is easy. Virtually all price manipulations in history have been of the upside variety which caused prices to be higher than they should have been. Buying an asset priced artificially high is a surefire prescription for eventual financial loss. But because the manipulation in silver is of the rare downside variety, the price of silver is artificially low, thereby guaranteeing eventual profits for those taking advantage of the opportunity.
Please understand that if the bulk of the COMEX silver short position was held by hundreds or thousands of separate traders, there would be no manipulation possible and I wouldn’t contend otherwise. But the COMEX silver short position is held by very few traders and it is that concentration that equals price manipulation. Since there is no obvious explanation why just 4 and 8 large traders would be more heavily short silver than in any other commodity, away from seeking to cap and control prices, the most plausible conclusion is that they are protecting and continuing their perfect trading record scam.
Ted, like Ed Steer, is implying that the silver market price is being manipulated by the bullion banks' massive short positions. While I agree with these analysts that silver does indeed have the largest concentration of short positions compared to any other metal or commodity, there is another factor that needs to be considered.
As I have mentioned in many articles and interviews, the prices of energy, metals, and commodities are based on their cost of production, rather than supply and demand forces. Yes, it is true that supply and demand forces impact the price, but on a short-term basis. If we take a look at the following two charts, we can see that cost to produce gold and silver parallel the market price:
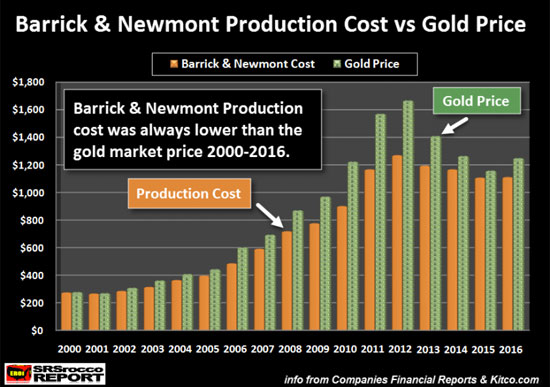
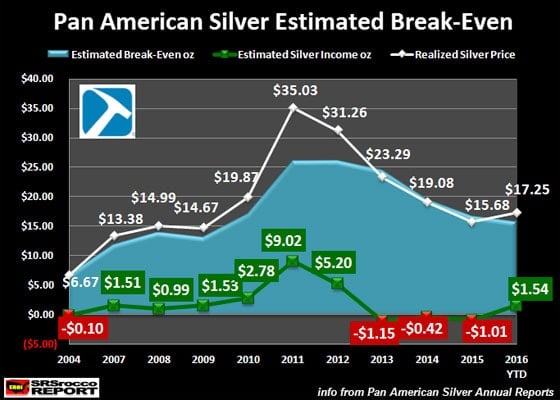
In the first chart, Barrick and Newmont’s cost of production was always lower than the gold market price. Even though these gold miners may have suffered net income losses during certain periods, I used “adjusted income,” rather than net income. The same was done for Pan American Silver. When the silver price was $35 in 2011, Pan American Silver enjoyed a $9 profit per ounce. However, as the price fell, so did its cost of production. The reason for the lower silver cost at Pan American Silver was due to falling energy prices and massive cutbacks in exploration and spending.
The following chart shows how Pan American Silver’s cost of production paralleled the change in the price of oil:

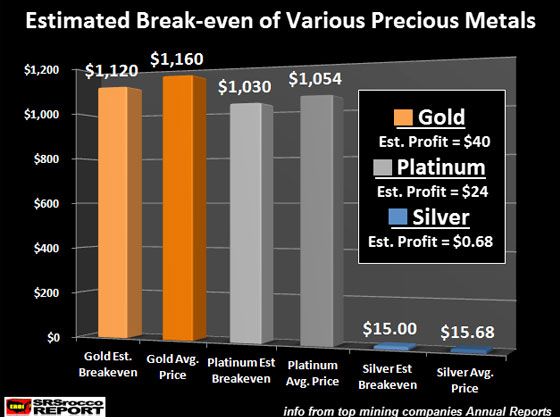
Regardless, the cost to produce silver has always been tied to the market price. This is also true for gold and copper. I looked at the top gold, silver, and copper miners’ Q1-Q3 2017 financials, and here were their profit margins:
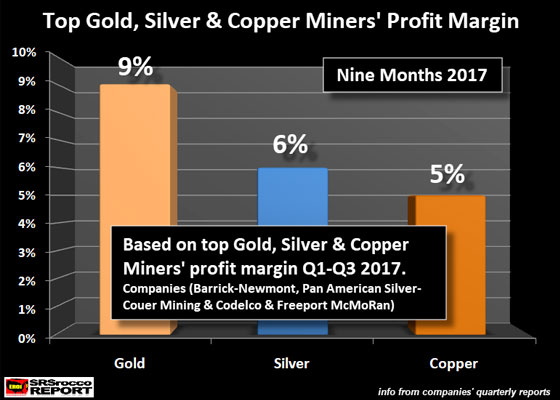
According to Barrick and Newmont’s financial results, the average profit margin for these two gold miners was 9% versus 6% for Pan American Silver and Coeur Mining, and 5% for Chile’s Codelco and Freeport McMoRan. Thus, the cost to produce gold, silver, and copper by the top major companies was still less than the market price.
So, if we take the Concentration of Traders' Short Positions in days of production and add the profit margin, we can see that there’s more to the story:
While it’s true that silver has the largest concentrated short position of any other metal or commodity, most of the silver miners are still making profits. Furthermore, it is also true for companies producing platinum:
Now, this is an older chart from 2015. However, we can see that even platinum’s production cost was very close to its market price. Even though platinum has the second-largest concentration of short positions in days of production, the market price is still very close to its cost of production.
Unfortunately, Ted Butler and Ed Steer do not include the cost of production in their analysis of the silver market price. While I agree that the banks are controlling the silver price, the majority of manipulation is taking place by propping up the STOCKS, BONDS & REAL ESTATE values. According to Savills World Research, the value of global assets in 2015 equaled $372 trillion. With the majority of the world’s wealth invested in stocks, bonds, and real estate, the Central Banks’ manipulation is focused on keeping these values from falling.
The coming surge in the silver price will be due to the disintegration of the global oil industry and the negative impact on the value of stocks, bonds, and real estate, rather than the number of bullion banks' silver short positions.

About the Author:
Independent researcher Steve St. Angelo started to invest in precious metals in 2002. In 2008, he began researching areas of the gold and silver market that the majority of the precious metal analyst community has left unexplored. These areas include how energy and the falling EROI – Energy Returned On Invested – stand to impact the mining industry, precious metals, paper assets, and the overall economy.
