Podcast Center
 Video Center
 Webcasts
 Resource Center
 Events


 By
By  July 05, 2022 at 05:01 PM


Possible early COVID-19 surge indicators — new hospital admissions statistics for patients with the virus that causes COVID-19 — are continuing to move higher.
The number of U.S. hospital admissions of patients with confirmed cases of COVID-19 increased to 34,227 in the week ending June 28. That’s up 12% from the total for the previous week, according to federal government Community Profile Report data that was last updated June 30.
Typical retirement and insurance advisors may be especially interested in the impact of the pandemic on working-age clients and prospects.
The number of pandemic-related hospital admissions of U.S. residents ages 18 through 59 also increased 12%, to 10,597.
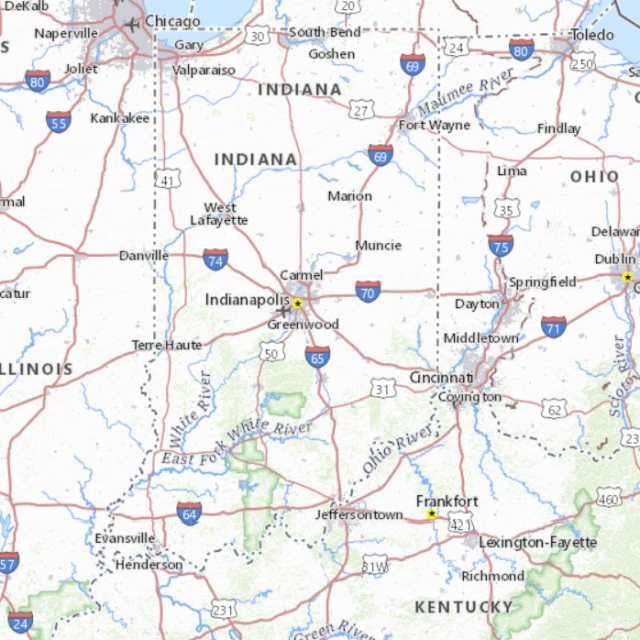
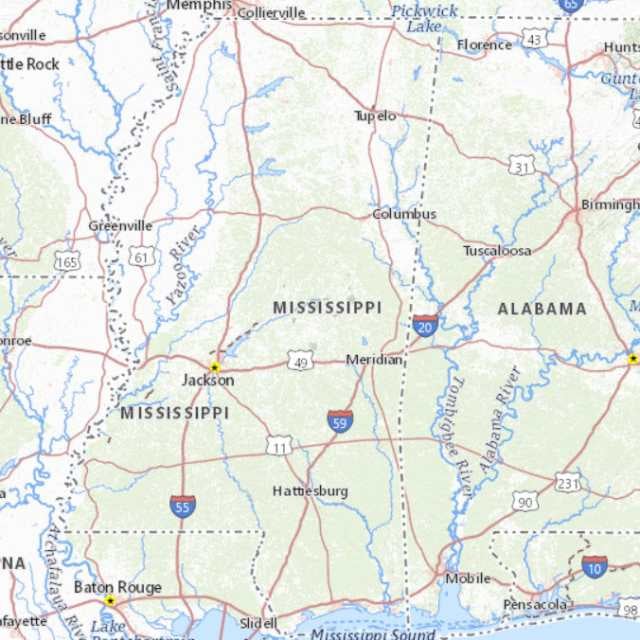
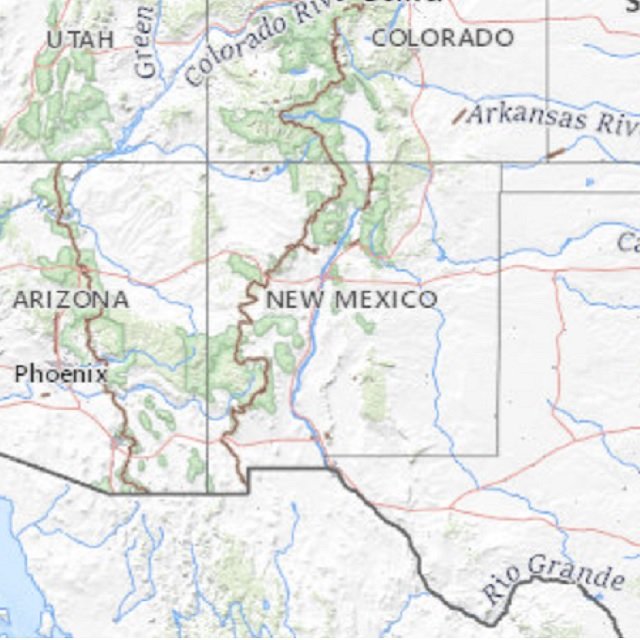
For a look at the five states with the biggest percentage increases in the number of pandemic-related hospitalizations of people in the 18-to-59 age group, see the gallery above.
For data on all 50 states and the District of Columbia, see the table below.
The figures range from a decrease of about 67%, in Wyoming, up to an increase of 97%, in another state.
What It Means
The overall COVID-19 hospital admissions count has been increasing every week since April 5.
The ratio of COVID-19 deaths to COVID-19 cases has fallen about 88% from what it was in June 2021, to about one new COVID-19 death for every 300 new COVID-19 cases, but one challenge is that increased use of home testing and changes in testing programs have made tracking the number of new cases difficult.
The result is that advisors who need accurate estimates of clients’ or employer plan participants’ mortality rate and life expectancy may continue to face a high rate of mortality uncertainty.
New Hospital Admissions for COVID-19 Patients Ages 18-59
| Week Ending | |||
|---|---|---|---|
| June 28 | June 21 | Change | |
| Alabama | 172 | 134 | 28.4% |
| Alaska | 25 | 22 | 13.6% |
| Arizona | 221 | 212 | 4.2% |
| Arkansas | 78 | 58 | 34.5% |
| California | 1,441 | 1,232 | 17.0% |
| Colorado | 206 | 202 | 2.0% |
| Connecticut | 90 | 94 | -4.3% |
| Delaware | 34 | 28 | 21.4% |
| District of Columbia | 51 | 48 | 6.3% |
| Florida | 1,263 | 1,237 | 2.1% |
| Georgia | 326 | 279 | 16.8% |
| Hawaii | 67 | 64 | 4.7% |
| Idaho | 69 | 59 | 16.9% |
| Illinois | 406 | 401 | 1.2% |
| Indiana | 178 | 113 | 57.5% |
| Iowa | 61 | 66 | -7.6% |
| Kansas | 58 | 53 | 9.4% |
| Kentucky | 157 | 185 | -15.1% |
| Louisiana | 199 | 179 | 11.2% |
| Maine | 14 | 23 | -39.1% |
| Maryland | 171 | 181 | -5.5% |
| Massachusetts | 168 | 170 | -1.2% |
| Michigan | 209 | 176 | -18.8% |
| Minnesota | 146 | 140 | 4.3% |
| Mississippi | 108 | 67 | 61.2% |
| Missouri | 234 | 194 | 20.6% |
| Montana | 53 | 48 | 10.4% |
| Nebraska | 46 | 43 | 7.0% |
| Nevada | 146 | 105 | 39.0% |
| New Hampshire | 38 | 24 | 58.3% |
| New Jersey | 276 | 233 | 18.5% |
| New Mexico | 100 | 58 | 72.4% |
| New York | 605 | 545 | 11.0% |
| North Carolina | 258 | 237 | 8.9% |
| North Dakota | 11 | 22 | -50.0% |
| Ohio | 300 | 236 | 27.1% |
| Oklahoma | 92 | 83 | 10.8% |
| Oregon | 145 | 130 | 11.5% |
| Pennsylvania | 245 | 252 | -2.8% |
| Rhode Island | 8 | 15 | -46.7% |
| South Carolina | 125 | 107 | 16.8% |
| South Dakota | 22 | 25 | -12.0% |
| Tennessee | 150 | 130 | 15.4% |
| Texas | 974 | 742 | 31.3% |
| Utah | 121 | 124 | -2.4% |
| Vermont | 11 | 9 | 22.2% |
| Virginia | 212 | 232 | -8.6% |
| Washington | 268 | 185 | 44.9% |
| West Virginia | 73 | 37 | 97.3% |
| Wisconsin | 114 | 141 | -19.1% |
| Wyoming | 3 | 9 | -66.7% |
| TOTAL | 10,597 | 9,449 | 12.1% |
| MEDIAN | 10.8% | ||
(Image: iStock)


 Slideshow