Podcast Center
 Video Center
 Webcasts
 Resource Center
 Events


 By
By  October 22, 2021 at 03:40 PM


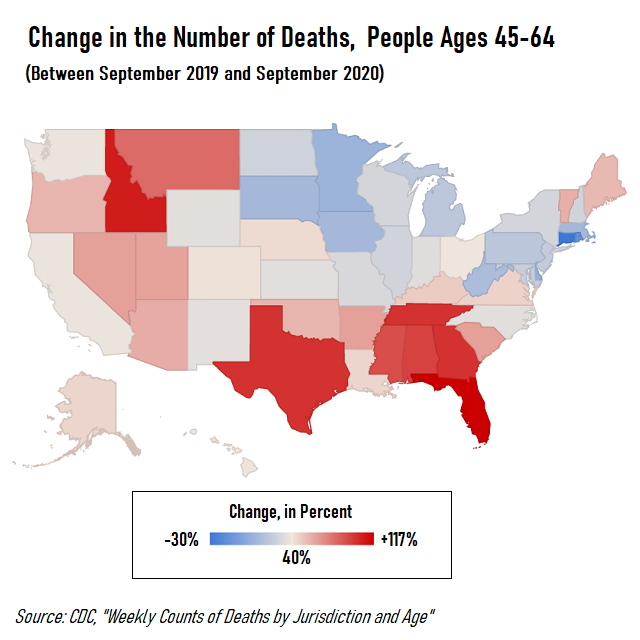
In a typical state, the number of people ages 45 through 64 who died in September 2021 was 42% higher than in September 2019.
The United States is on track to record 61,532 deaths of people ages 45 through 64 for this past September, compared with 39,869 deaths in the 45-64 age group in September 2019, before the COVID-19 pandemic began, according to predicted death count data from the Centers for Disease Control and Prevention’s National Center for Health Statistics.
The Backdrop
Those figures are based on the CDC’s predicted numbers. The 2019 numbers are based on figures that are close to the final numbers. The 2021 numbers may change as states send data updates to the CDC.
The figures include deaths occurring as a result of COVID-19 and all other causes, such as cancer, accidents and heart disease.
The CDC’s predicted numbers show that the total number of U.S. deaths increased 34% between September 2019 and September 2021, to 280,108.
The United States is home to about 328 million people, and about 83 million people ages 45 through 64.
The numbers mean that, if the September mortality rate continued for the whole year, the odds of dying would have increased to 1 in 98 for all Americans, from 1 in 131 before the pandemic started.
For people ages 45 through 64, the death count increase in September translates into an annualized change in odds to 1 chance in dying per 113 people the 45-64 age group, from 1 in 174 before COVID-19 appeared.
The Details
Some states have been faster at reporting 2021 data than others.
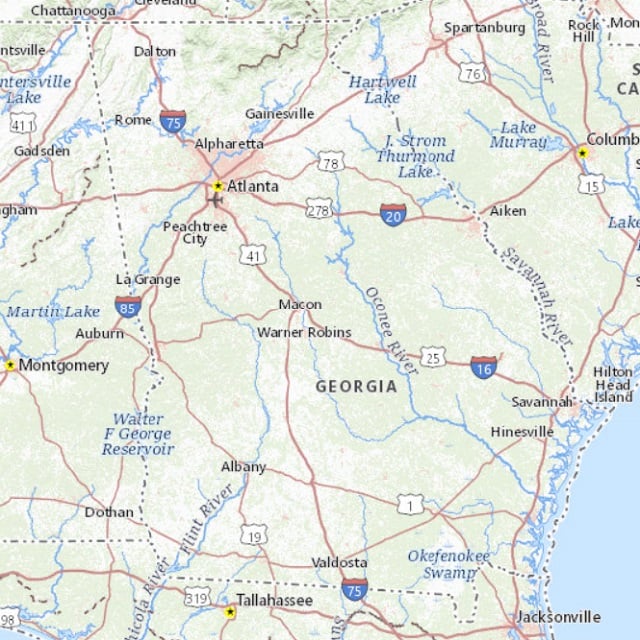
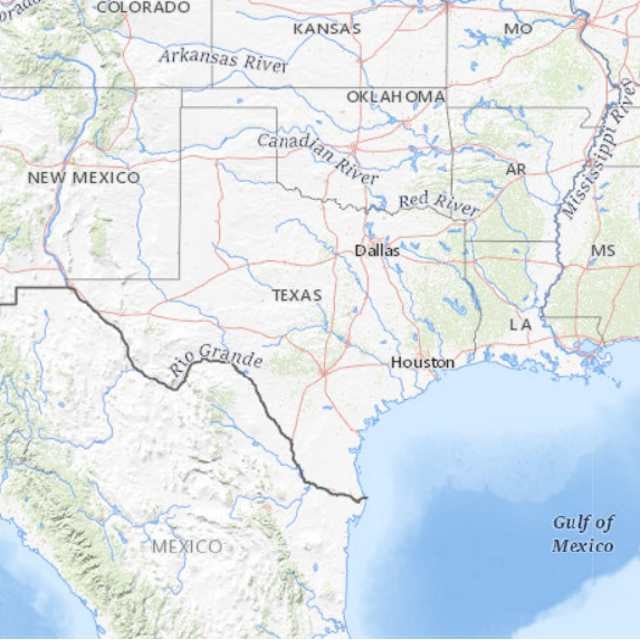
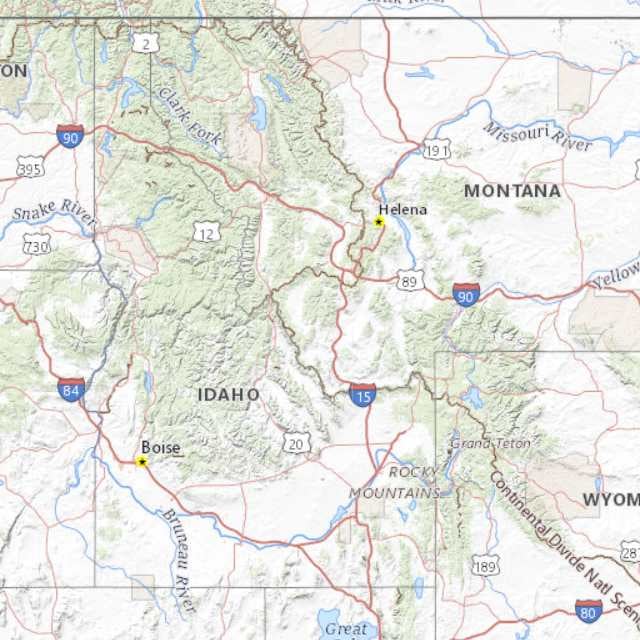
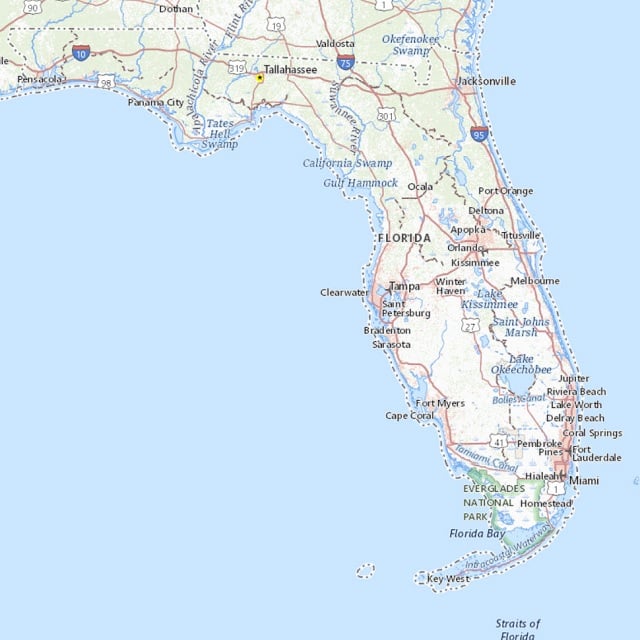
At the state level, based on the predicted data now in the CDC weekly death count spreadsheet, the percentage change in deaths in the 45-64 age group between September 2019 and September 2021 ranged from a decrease of 30% in Connecticut up to more than 100% in five states.
When the total number of deaths has increased by more than 100%, that means the number in the latest reporting period is more than twice as high as in the earlier reporting period.
For a chart showing data for all 50 states and some other jurisdictions, see the table below.
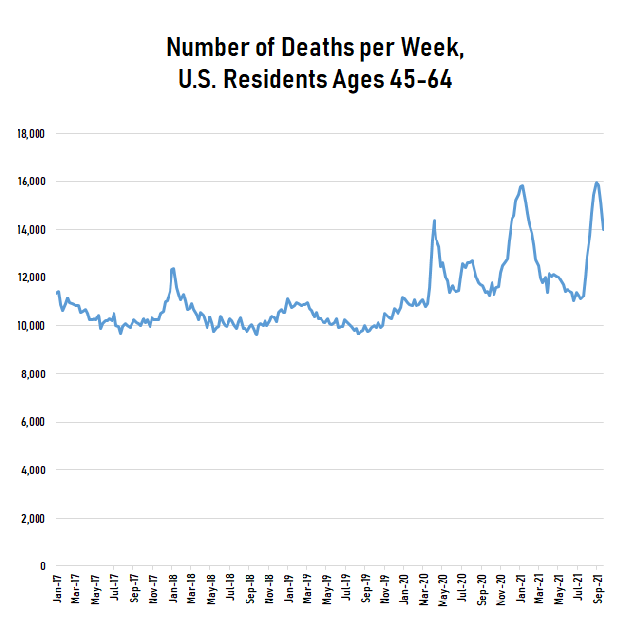
Look below that for a chart providing the monthly U.S. death totals for people ages 45-64, from January 2017 through the end of September 2021. Although the numbers are based on the CDC’s predicted data, the totals for August 2021 and September 2021 may be especially incomplete. These figures are based on the CDC’s national totals.
For the five states with percentage changes over 100%, see the slideshow above.
Deaths of People Ages 45-64, in September
| These death totals are based on the CDC’s predicted figures. The 2021 numbers could change when states send in more complete reports. | |||
| September 2019 Deaths | September 2021 Deaths | Change in the Number of Deaths | |
|---|---|---|---|
| Alabama | 849 | 1,663 | +96% |
| Alaska | 83 | 124 | +49% |
| Arizona | 809 | 1,310 | +62% |
| Arkansas | 500 | 830 | +66% |
| California | 3,633 | 5,163 | +42% |
| Colorado | 549 | 795 | +45% |
| Connecticut | 350 | 245 | -30% |
| Delaware | 164 | 176 | +7% |
| District of Columbia | 115 | 113 | -2% |
| Florida | 2,737 | 5,952 | +117% |
| Georgia | 1,398 | 2,805 | +101% |
| Hawaii | 160 | 231 | +44% |
| Idaho | 165 | 343 | +108% |
| Illinois | 1,436 | 1,880 | +31% |
| Indiana | 932 | 1,278 | +37% |
| Iowa | 381 | 430 | +13% |
| Kansas | 353 | 488 | +38% |
| Kentucky | 837 | 1,272 | +52% |
| Louisiana | 752 | 1,122 | +49% |
| Maine | 162 | 256 | +58% |
| Maryland | 692 | 879 | +27% |
| Massachusetts | 688 | 777 | +13% |
| Michigan | 1,373 | 1,694 | +23% |
| Minnesota | 490 | 539 | +10% |
| Mississippi | 545 | 1,046 | +92% |
| Missouri | 946 | 1,269 | +34% |
| Montana | 121 | 222 | +83% |
| Nebraska | 184 | 270 | +47% |
| Nevada | 411 | 684 | +66% |
| New Hampshire | 149 | 195 | +31% |
| New Jersey | 906 | 1,138 | +26% |
| New Mexico | 288 | 401 | +39% |
| New York | 1,097 | 1,453 | +32% |
| New York City | 821 | 1,015 | +24% |
| North Carolina | 1,422 | 1,964 | +38% |
| North Dakota | 99 | 129 | +30% |
| Ohio | 1,737 | 2,481 | +43% |
| Oklahoma | 627 | 999 | +59% |
| Oregon | 474 | 752 | +59% |
| Pennsylvania | 1,660 | 2,028 | +22% |
| Puerto Rico | 364 | 551 | +51% |
| Rhode Island | 128 | 112 | -13% |
| South Carolina | 761 | 1,265 | +66% |
| South Dakota | 121 | 137 | +13% |
| Tennessee | 1,188 | 2,384 | +101% |
| Texas | 3,139 | 6,323 | +101% |
| Utah | 227 | 375 | +65% |
| Vermont | 62 | 100 | +61% |
| Virginia | 944 | 1,416 | +50% |
| Washington | 788 | 1,120 | +42% |
| West Virginia | 334 | 386 | +16% |
| Wisconsin | 640 | 844 | +32% |
| Wyoming | 78 | 108 | +38% |
| TOTAL | 39,869 | 61,532 | - |
| MEDIAN | - | - | +42% |
Monthly U.S. Deaths, People Ages 45-64, January 2017 to September 2021
| Number of Deaths | |
| January 2017 | 44,291 |
| February 2017 | 43,941 |
| March 2017 | 43,111 |
| April 2017 | 52,305 |
| May 2017 | 40,887 |
| June 2017 | 40,803 |
| July 2017 | 50,451 |
| August 2017 | 39,982 |
| September 2017 | 50,569 |
| October 2017 | 40,652 |
| November 2017 | 41,096 |
| December 2017 | 54,622 |
| January 2018 | 47,655 |
| February 2018 | 44,148 |
| March 2018 | 53,068 |
| April 2018 | 41,183 |
| May 2018 | 40,191 |
| June 2018 | 50,531 |
| July 2018 | 40,456 |
| August 2018 | 40,291 |
| September 2018 | 49,350 |
| October 2018 | 40,343 |
| November 2018 | 40,970 |
| December 2018 | 52,541 |
| January 2019 | 43,688 |
| February 2019 | 43,622 |
| March 2019 | 53,609 |
| April 2019 | 41,284 |
| May 2019 | 40,534 |
| June 2019 | 50,231 |
| July 2019 | 40,401 |
| August 2019 | 48,945 |
| September 2019 | 39,515 |
| October 2019 | 39,992 |
| November 2019 | 51,561 |
| December 2019 | 42,610 |
| January 2020 | 44,177 |
| February 2020 | 54,624 |
| March 2020 | 44,346 |
| April 2020 | 54,915 |
| May 2020 | 60,390 |
| June 2020 | 46,139 |
| July 2020 | 49,676 |
| August 2020 | 61,606 |
| September 2020 | 46,239 |
| October 2020 | 57,620 |
| November 2020 | 50,170 |
| December 2020 | 57,847 |
| January 2021 | 76,943 |
| February 2021 | 54,229 |
| March 2021 | 48,294 |
| April 2021 | 47,777 |
| May 2021 | 59,194 |
| June 2021 | 45,381 |
| July 2021 | 57,036 |
| August 2021* | 56,851 |
| September 2021* | 61,532 |
| * Based on incomplete, predicted figures. | |
The featured image shows a map reflecting percentage changes in the number of deaths of people ages 45 through 64 between September 2019 and September 2021, based on preliminary CDC data. (Image: Allison Bell/ALM)


 Slideshow