What You Need to Know
- The number of people ages 30 through 59 hospitalized with COVID-19 rose to 15,680, from 12,087, in just a month.
- The COVID-19 hospitalization count for people ages 60 and older increased 3.1%.
- Yet the COVID-19 hospitalization count for people under 30 rose 25%, to 3,346.
The COVID-19 pandemic may be continuing to become more of a problem for adults who are in their prime working years than for people ages 60 and older.
The Data Strategy and Execution Workgroup, part of the White House effort to coordinate the fight against the pandemic, has told the story in its daily Community Profile Report spreadsheets.
The reports contain extensive information about everything about the number of new COVID-19 cases, to hospital ICU bed occupancy rates, to the progress of the COVID-19 vaccination effort.
The reports give detailed age breakdowns for just one type of data stream: hospitalizations.
The United States has given more than 82% of the 54 million people ages 65 and older at least one dose of a COVID-19 vaccine.
Only about half of the 200 million adults under 65 have been vaccinated.
The focus on vaccinating people over 65 is probably reducing the COVID-19 death rate during this fourth wave of COVID-19, but the wave has been leading to a noticeable increase in hospitalization counts for younger adults.
The shift could mean that, going forward, a higher percentage of people who have severe cases of COVID-19 will also have commercial health insurance, rather than Medicare, and life insurance.
Here’s what’s happened to the number of COVID-19 hospitalizations, between March 25 and April 25, for three age groups, according to Community Profile Report data:
- Under 30: 3,346 (Up 25%)
- Ages 30-59: 15,680 (Up 29.7%)
- Ages 60 and Older: 17,030 (Up 3.1%)
Accelerating efforts to offer vaccinations to people ages 30 to 59 could begin to change the data.
The percentage of hospitalized patients with COVID-19 who are ages 30 to 69 fell to 58% Monday, from 61% last week.
That might be a sign that the country is starting to stop the fourth wave from rolling over the prime working-age population.
The hospitalization count picture for people ages 30 through 59 vary widely from state to state.
The number fell 30% in the state with the best performance, Alabama, and increased by more than 130% in five states and Puerto Rico, with a median of about 32%.
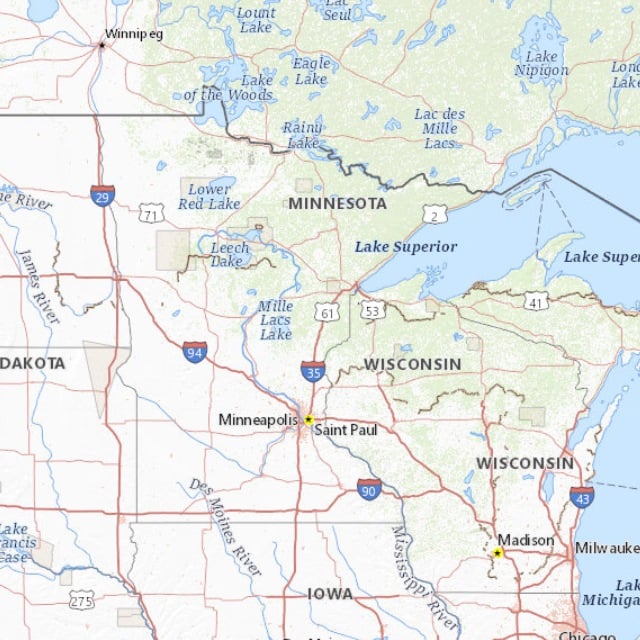
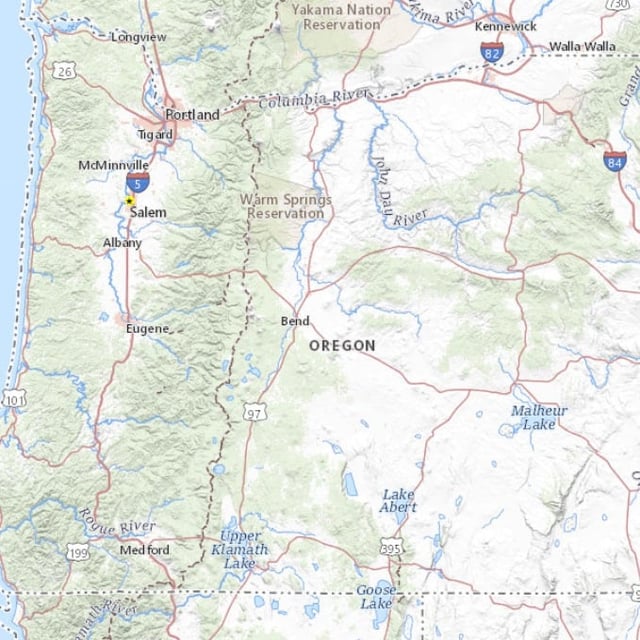
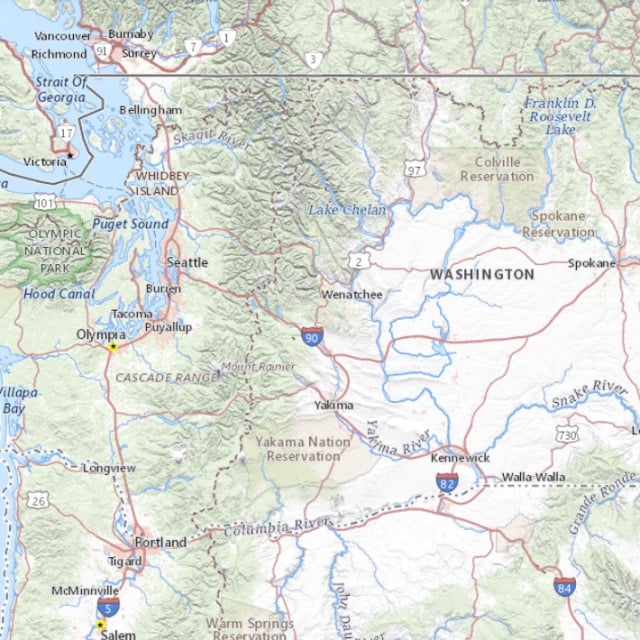
For a look at the five states with the biggest increases in hospitalization counts for prime working-age people, see the slideshow above.
.
Hospitalizations of Patients Ages 30 to 59 With Confirmed COVID-19 |
||
| Hospitalizations | Percentage Change From March 25 | |
|---|---|---|
| Alabama | 174 | -30.1% |
| Alaska | 19 | 5.6% |
| Arizona | 208 | 17.5% |
| Arkansas | 80 | 31.1% |
| California | 737 | -22.0% |
| Colorado | 293 | 48.0% |
| Connecticut | 261 | 17.0% |
| Delaware | 78 | 73.3% |
| District of Columbia | 65 | 47.7% |
| Florida | 1,661 | 39.5% |
| Georgia | 478 | 6.5% |
| Hawaii | 18 | 125.0% |
| Idaho | 38 | 15.2% |
| Illinois | 768 | 110.4% |
| Indiana | 276 | 91.7% |
| Iowa | 80 | 8.1% |
| Kansas | 64 | 36.2% |
| Kentucky | 184 | 23.5% |
| Louisiana | 137 | 14.2% |
| Maine | 38 | 192.3% |
| Maryland | 549 | 67.4% |
| Massachusetts | 306 | 49.3% |
| Michigan | 1,421 | 116.3% |
| Minnesota | 324 | 133.1% |
| Mississippi | 40 | -25.9% |
| Missouri | 157 | 16.3% |
| Montana | 31 | 72.2% |
| Nebraska | 43 | 34.4% |
| Nevada | 146 | 39.0% |
| New Hampshire | 40 | 81.8% |
| New Jersey | 640 | -5.6% |
| New Mexico | 49 | -10.9% |
| New York | 1,193 | -12.7% |
| North Carolina | 432 | 29.0% |
| North Dakota | 30 | 50.0% |
| Ohio | 617 | 52.7% |
| Oklahoma | 102 | -23.3% |
| Oregon | 116 | 163.6% |
| Pennsylvania | 969 | 82.5% |
| Puerto Rico | 249 | 730.0% |
| Rhode Island | 40 | 150.0% |
| South Carolina | 205 | 7.9% |
| South Dakota | 39 | 129.4% |
| Tennessee | 284 | 14.1% |
| Texas | 1,066 | -6.7% |
| Utah | 77 | -13.5% |
| Vermont | 22 | 83.3% |
| Virginia | 309 | 10.4% |
| Washington | 214 | 189.2% |
| West Virginia | 110 | 111.5% |
| Wisconsin | 190 | 77.6% |
| Wyoming | 13 | -7.1% |
| TOTAL | 15,680 | 29.7% |
.
(Photo: Adobe Stock)


 April 27, 2021 at 02:42 PM


 Slideshow


