Podcast Center
 Video Center
 Webcasts
 Resource Center
 Events


 By
By  December 03, 2020 at 09:45 AM


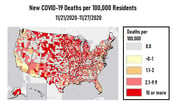
COVID-19 may have caused about two deaths for every 1,000 U.S. nursing home residents in the week ending Nov. 15, and it may have accounted for about 27% of the 8,587 deaths that occurred in nursing homes that week, according to government nursing home data..
The COVID-19 nursing home death rate has increased from 1.3 deaths per 1,000 occupied nursing home beds in the week ending Oct. 18, and from 1 death per 1,000 occupied nursing home beds in the week ending Sept. 20.
The percentage of all nursing home deaths attributed to COVID-19 has increased from 20% in mid-October, and from 16% in mid-September.
The Centers for Medicare and Medicaid Services (CMS) posts the COVID-19 tracking data for nursing homes on its website.
Resources
- A set of CMS nursing home COVID-19 tracking data for the week ending Nov. 15 is available here.
- An article about the latest White House Coronavirus Task Force weekly report is available here.
The CMS nursing home COVID-19 data can give professionals involved with life insurance, annuities and long-term care insurance an idea of how the pandemic is affecting people in nursing homes.
Increased nursing home mortality could increase permanent life insurance death claims; reduce reserves for long-term care insurance benefits, group annuity benefits and individual annuity income benefits; and increase individual annuity issuers’ spending on any death benefit provisions built into contracts.
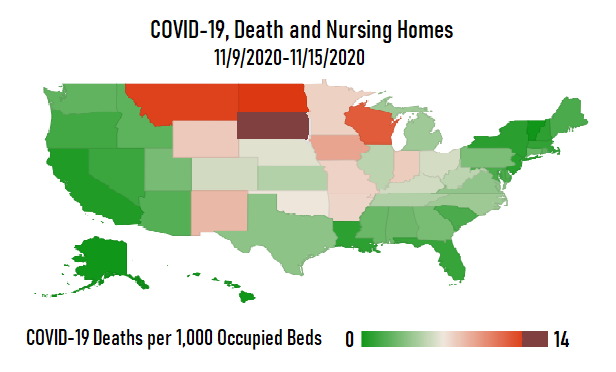
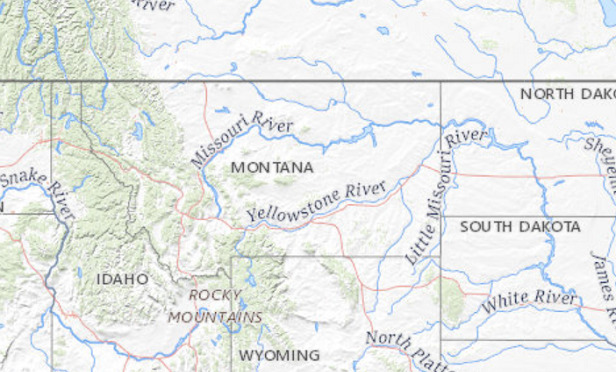
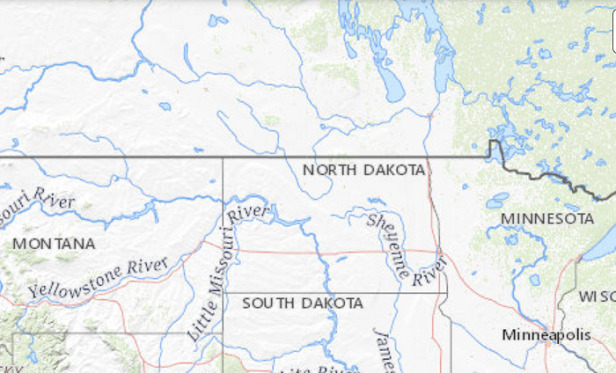
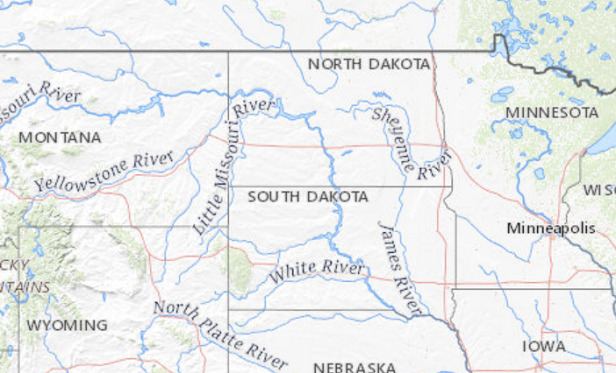
For a look at the six states where COVID-19 caused more than 5 deaths per 1,000 occupied beds — or, in other words, more than 1 death per 200 residents — in the week ending Nov. 15, see the slideshow above.
Data Nuts and Bolts
CMS began collecting the data in the current form May 17. That means the spreadsheets leave out the period from mid-March through early May, when COVID-19 caused a massive wave of deaths in New York, Boston, New Orleans and some other cities in March and April.
Some nursing homes are unwilling or unable to send in data, and CMS has no authority to collect data from long-term care facilities other than nursing homes.
The CMS nursing home tracking spreadsheet for the latest week covers nursing homes with 1.6 million beds, and 1.1 million occupied beds.
Nursing Home Data Analysis Challenges
Regional differences in how people use nursing homes, and how COVID-19 has affected nursing home use, may affect the nursing home COVID-19 impact numbers.
U.S. nursing home residents tend to have serious health problems. From July 1, 2012, through Dec. 31, 2013, they had a mortality rate of about 7 deaths per 1,000 residents per week, according to a 2017 study conducted by researchers affiliated with the University of Texas Medical Branch in Galveston, Texas.
Before the pandemic began, some communities worked harder than others to keep relatively healthy people who needed long-term care in their own homes. Other communities made less use of home care. Regional variations in emphasis on home care mean that the typical health status of a nursing home resident, and the typical nursing home resident’s life expectancy, varied widely from state to state before the COVID-19 pandemic began.
Since the COVID-19 pandemic started, and stories about deadly nursing home outbreaks appeared, many families and communities have pushed to keep people out of nursing homes.
Because of that push, the people still in nursing homes may now have more serious health problems than typical nursing home residents had a year ago.
Medicare assigns each Medicare plan enrollee a heath risk score. Academic researchers and insurance industry analysts will be using the health risk scores to see how much of the current increase in nursing home mortality is due to COVID-19 and how much is due to the nursing home residents’ underlying health problems.
.
U.S. Nursing Home COVID-19 Tracking Data (for the week ending Nov. 15) |
||||||
| State | Total Weekly Resident Deaths | Weekly COVID-19 Deaths | Percentage of Deaths Caused by COVID-19 | Number of Occupied Beds | COVID-19 deaths per 1,000 occupied beds | Total Deaths per 1,000 Occupied Beds |
|---|---|---|---|---|---|---|
| Alabama | 128 | 35 | 27% | 19,533 | 1.8 | 6.6 |
| Alaska | 2 | - | 0% | 646 | 0.0 | 3.1 |
| Arizona | 47 | 13 | 28% | 10,005 | 1.3 | 4.7 |
| Arkansas | 131 | 66 | 50% | 14,361 | 4.6 | 9.1 |
| California | 136 | 26 | 19% | 86,593 | 0.3 | 1.6 |
| Colorado | 121 | 51 | 42% | 13,966 | 3.7 | 8.7 |
| Connecticut | 116 | 31 | 27% | 17,978 | 1.7 | 6.5 |
| Delaware | 24 | 4 | 17% | 3,297 | 1.2 | 7.3 |
| District of Columbia | 8 | - | 0% | 1,651 | 0.0 | 4.8 |
| Florida | 273 | 46 | 17% | 62,275 | 0.7 | 4.4 |
| Georgia | 198 | 54 | 27% | 27,333 | 2.0 | 7.2 |
| Hawaii | 12 | - | 0% | 3,039 | 0.0 | 3.9 |
| Idaho | 20 | 5 | 25% | 3,450 | 1.4 | 5.8 |
| Illinois | 390 | 180 | 46% | 55,926 | 3.2 | 7.0 |
| Indiana | 342 | 159 | 46% | 32,823 | 4.8 | 10.4 |
| Iowa | 219 | 114 | 52% | 19,625 | 5.8 | 11.2 |
| Kansas | 114 | 46 | 40% | 14,933 | 3.1 | 7.6 |
| Kentucky | 189 | 72 | 38% | 19,861 | 3.6 | 9.5 |
| Louisiana | 100 | 12 | 12% | 21,846 | 0.5 | 4.6 |
| Maine | 51 | 6 | 12% | 5,356 | 1.1 | 9.5 |
| Maryland | 134 | 22 | 16% | 20,302 | 1.1 | 6.6 |
| Massachusetts | 189 | 20 | 11% | 30,569 | 0.7 | 6.2 |
| Michigan | 410 | 83 | 20% | 30,738 | 2.7 | 13.3 |
| Minnesota | 215 | 97 | 45% | 20,639 | 4.7 | 10.4 |
| Mississippi | 89 | 24 | 27% | 14,013 | 1.7 | 6.4 |
| Missouri | 292 | 154 | 53% | 32,854 | 4.7 | 8.9 |
| Montana | 51 | 26 | 51% | 3,178 | 8.2 | 16.0 |
| Nebraska | 107 | 38 | 36% | 9,635 | 3.9 | 11.1 |
| Nevada | 19 | 4 | 21% | 4,874 | 0.8 | 3.9 |
| New Hampshire | 35 | 3 | 9% | 5,574 | 0.5 | 6.3 |
| New Jersey | 156 | 16 | 10% | 33,979 | 0.5 | 4.6 |
| New Mexico | 44 | 24 | 55% | 4,509 | 5.3 | 9.8 |
| New York | 463 | 44 | 10% | 89,749 | 0.5 | 5.2 |
| North Carolina | 311 | 84 | 27% | 31,289 | 2.7 | 9.9 |
| North Dakota | 80 | 38 | 48% | 4,520 | 8.4 | 17.7 |
| Ohio | 522 | 227 | 43% | 61,467 | 3.7 | 8.5 |
| Oklahoma | 136 | 66 | 49% | 15,784 | 4.2 | 8.6 |
| Oregon | 28 | 6 | 21% | 6,536 | 0.9 | 4.3 |
| Pennsylvania | 1,054 | 130 | 12% | 63,822 | 2.0 | 16.5 |
| Rhode Island | 40 | 9 | 23% | 6,063 | 1.5 | 6.6 |
| South Carolina | 87 | 17 | 20% | 15,137 | 1.1 | 5.7 |
| South Dakota | 109 | 67 | 61% | 4,882 | 13.7 | 22.3 |
| Tennessee | 221 | 74 | 33% | 24,198 | 3.1 | 9.1 |
| Texas | 450 | 176 | 39% | 74,932 | 2.3 | 6.0 |
| Utah | 22 | 10 | 45% | 5,075 | 2.0 | 4.3 |
| Vermont | 17 | - | 0% | 2,154 | 0.0 | 7.9 |
| Virginia | 166 | 58 | 35% | 23,747 | 2.4 | 7.0 |
| Washington | 165 | 21 | 13% | 13,505 | 1.6 | 12.2 |
| West Virginia | 63 | 28 | 44% | 8,638 | 3.2 | 7.3 |
| Wisconsin | 271 | 138 | 51% | 18,223 | 7.6 | 14.9 |
| Wyoming | 20 | 10 | 50% | 2,038 | 4.9 | 9.8 |
| UNITED STATES | 8,587 | 2,634 | 31% | 1,117,191 | 2.4 | 7.7 |
.
— Read Club Vita Forms COVID-19 Lifespan Impact Research Panel, on ThinkAdvisor.
— Connect with ThinkAdvisor Life/Health on Facebook, LinkedIn and Twitter.


 Slideshow