The 7 Most Interesting Social Media Studies and What to Learn From Them


 One of the first things I’ve learnt, close to 2 years ago when taking the plunge into Social Media with Buffer, was that things aren’t yet very defined.
There guiding metrics and studies are really just in their beginning phase and a lot is still quite vague. To help make things a tiny bit more clear, I thought it might be helpful to collect 10 of the most interesting social media studies and see what we can best learn from them.
So without any further ado, let’s dig in and talk about the most important social media stats out there:
1.) Over 120 Billion Facebook Impressions later – what we learnt
In a very interesting study BlitzLocal looked at close 120 billion Facebook impressions and tried to make sense of it all. Some of the most interesting facts came around lengths of posts. The researchers concluded:
“Longer posts tend to perform poorly. The ideal interaction being driven by posts is between 100 to 119 characters. Questions tend to drive interaction up by 10 to 20 percent.”
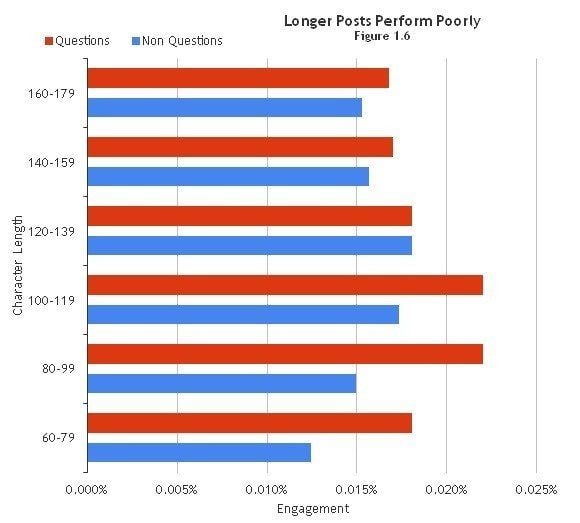
Key takeaway: Whilst most of us know to keep postings short, getting actual data behind it is useful. Another key insight from the study was to prioritize picture postings over links. Find hack number 2 here to do this more easily.
2.) Almost half of online customers expect brands to provide customer service on Facebook, but only 23% provide it
Here is something we’ve struggled a lot with ourselves at Buffer in the past: To provide great customer service on Facebook. I’m not sure why, but it’s always proven to be trickier than Twitter or email.
And yet, seeing that the bar for most people out there is extremely high definitely serves as a good motivator. Interestingly, much less people (only 17%) expect great customer service from Twitter.
Key takeaway: What this takes me back to is Gary Vaynerchuck’s quote:
”I genuinely believe that any business can create a competitive advantage through giving outstanding customer care.” ~ Gary Vaynerchuk
Meaning that, because so few people provide great customer service through Social Media, there is a huge opportunity for you to stand out and really wow the customer. At least for the next few years.
3.) The science of social timing: When, how often and where should you post?
This is something often and wildly discussed in the social media world. And the results don’t always add up from all the different research studies. Here are some of the most interesting results that I found:
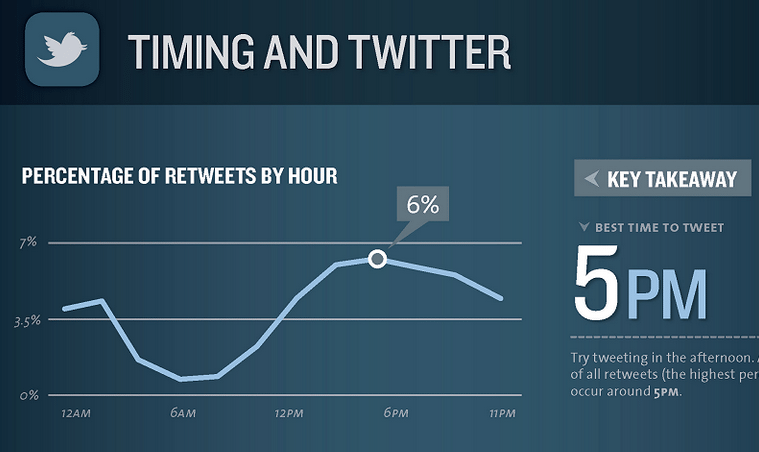
1.) Dan Zarrella and KISSmetrics (study):
- Best time to post on Twitter (for retweets): 5pm
- Best time to post on FB (for shares): 1pm
- Optimal amount to Tweet: 1-4 Tweets per hour
- Optimal amount to post to FB page: 0.5 times per day
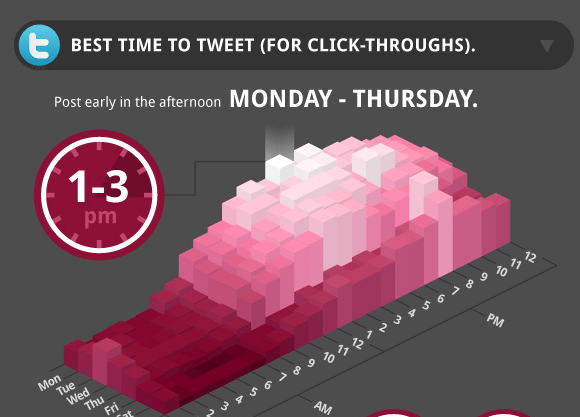
2.) Bit.ly and Raka (study):
- Best time to post on Twitter (for clicks): 1-3pm
- Best time to post on FB (for clicks): 3pm
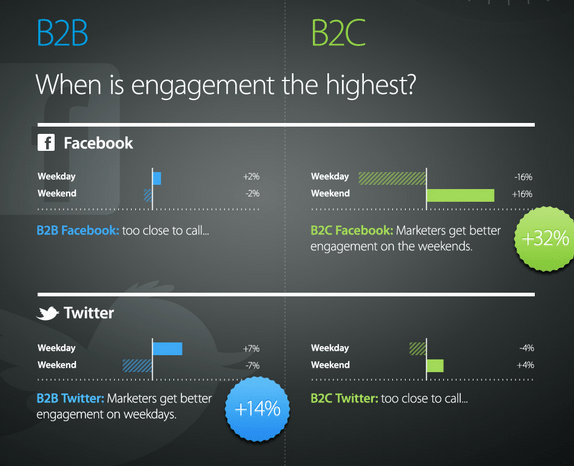
3.) Argyle Social (study):
- Best time to post to Twitter: 9am – 7pm
- Best time to post to Facebook: 9am – 7pm
- Best day of the week to Tweet: Any weekday gives 14% more engagement than weekend
- Best day of the week to post to Facebook: On weekends you get 32% more engagement
Key takeaway: With some of the smartest minds in social media having taken on the science of timing, one thing seems clear: No one arrives at one optimal solution. The best way we’ve found things to work is to experiment lots and see what works best for you. Making sure you get some actionable social media analytics seems more important than a general optimal timing.
4.) Click-Through Rates May Matter Even Less Than We Thought
Now here is an interesting one, that isn’t strictly speaking part of the other social media stats, but an overall online marketing study. The key insight from the study is this:
“The correlation between a click and a conversion is virtually nonexistent.”
The correlation between someone clicking and actually filling out a form and doing something was 0.1. What did however create a high conversion was to measure hover with the cursor. That resulted in a 0.49 correlation of actually converting and completing the call to action. On top of this, pure impressions also created a 0.35 correlation to conversion.
Key takeaway: Keith Pieper, CEO of Pretarget who created the study took this one for himself:
“My key takeaway is that optimizing to viewable impressions or hover time is a better proxy for a brand advertiser than a click-through rate.”
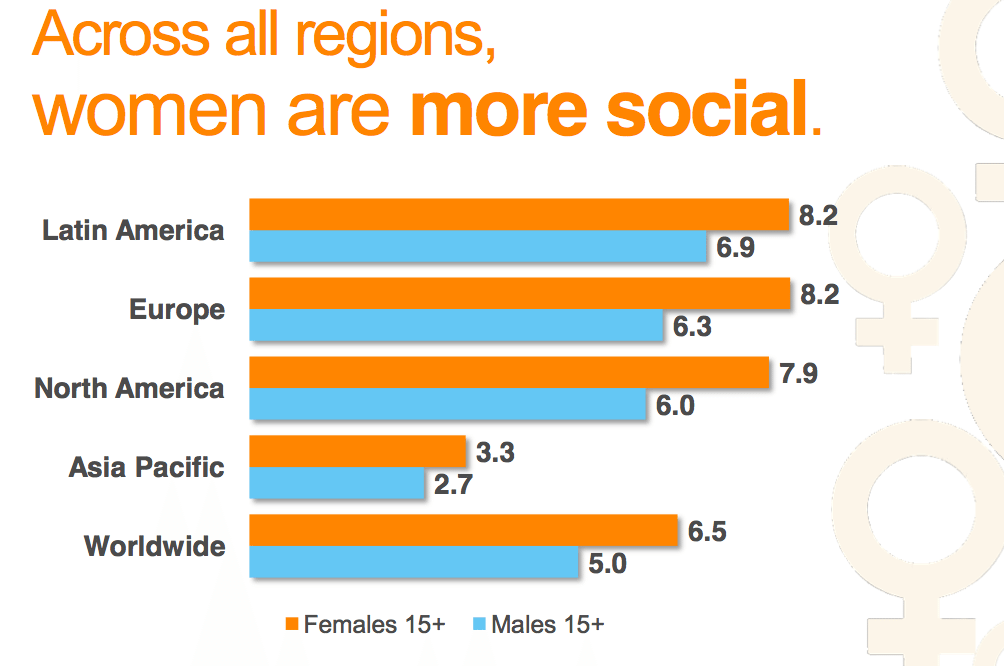
5.) 70% of Consumers Trust Brand Recommendations From Friends
This is something I feel most of us have known and every so often, research pops up to confirm this again. And yet, I feel it couldn’t be any more important to emphasize this, especially in the age of social media.
To have it all in overview, here is how it ranks from top to bottom:
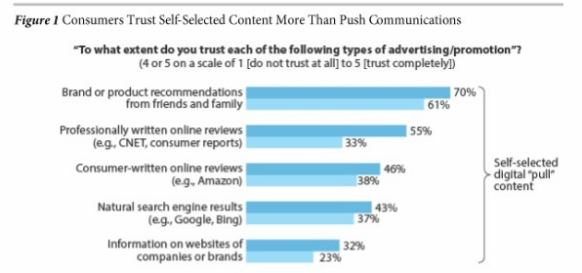
Personally, what I found most surprising from the study was this:
“Europeans trust all advertising communications less than Americans”
Key takeaway: Shifiting from the traditional “push” advertising model to a “pull” model that uses inbound marketing and friend recommendations as the core way to market is still very hard to grasp for most companies beyond the startup world. And yet, as HubSpot’s state of inbound marketing reveals, this is more important than ever. Go create awesome content for people to share and recommend!
6.) Social Networks Account for 20% of Time Spent Online ( more Facebook statistics)
I loved reading this study, simply because if you are in the social media trenches every day, it’s much harder to feel the growth and the movement that’s actually happening.
To put ComScore’s results even more impressively about social media usage:
“Social networking sites now reach 82 percent of the world’s online population, representing 1.2 billion users around the world”
Key takeaway: What the study didn’t highlight as much, was that “other content” still makes up around 30% of all online traffic. Other content contains to a large amount traffic from blogs and websites. Replacing your Facebook presence as your home base is something to avoid at all costs and a focus on a better funnel is more important than ever.
7.) Shelf Life of Social Media Links Only 3 Hours (bitly social media stats)
One of the most interesting studies from the recent past comes from analytics and shortening service Bitly. Any link you share on Facebook and Twitter will be mostly irrelevant after 3 hours. Especially our recent findings on Facebook statistics seems to also confirm this.
The most interaction will actually happen within the first 60 minutes, as Bitly shows in their graph:
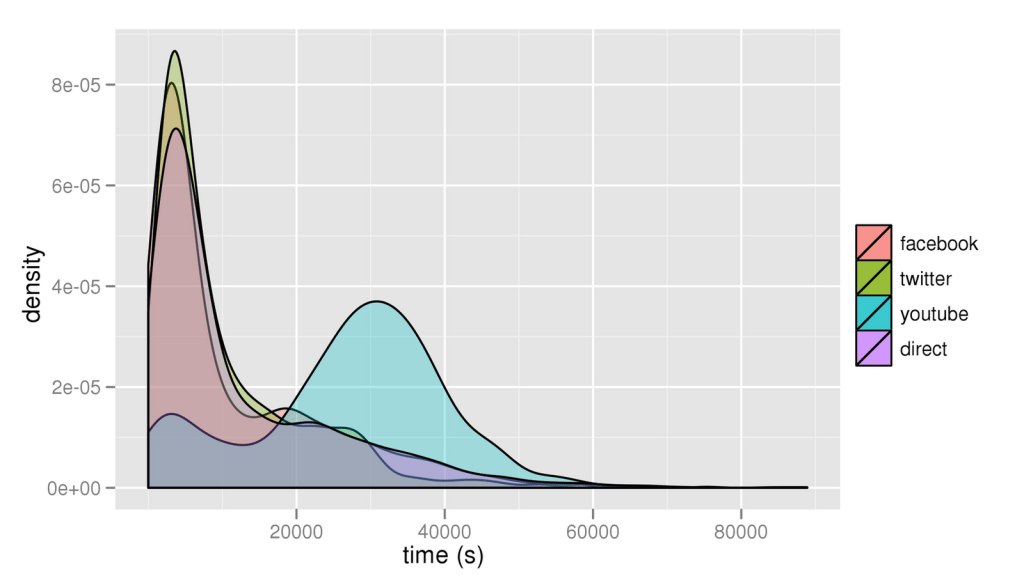
Key takeaway: The one key action point to take from this research I found is frequency of posting. Instead of fussing over the best times to post, finding high quality content that you can share consistently throughout the day is more important than ever
Quick last fact: “Women spend 30% more time on social networking sites than men”
A last most interesting insight from ComScore came about the time spent on social networking sites per gender. Their end result was that women are 30% more active, across not just time spent, but posting, clicking and overall engagement with content online.
I don’t dare to interpret this, it’s insanely interesting to say the least.
For more exciting social media statistics check out this post on the latest social media stats.
Writing this article showed me once again how fast social media stats are changing everything around us. Have you found any interesting data insights yourself? I’d love your insights on this.
Try Buffer for free
140,000+ small businesses like yours use Buffer to build their brand on social media every month
Get started nowRelated Articles

In this article, Nupur Mittal shares insights into four research methods that help her find content ideas and identify unique takeaways.
Facebook marketing in 2019 isn’t dead. On the contrary, it’s far from it. Now removed from the dim outlook that businesses faced at the beginning of 2018, Facebook has and will remain an essential tool for brands’ marketing strategies moving forward. In our big State of Social Media 2019 Report, we found that 93.7 percent of businesses use and are currently active on Facebook — the most among any other social media network. And although we continue to see a dramatic rise in the usage