One of the top trends in end-user computing (EUC) and IT operations for the Citrix teams is digital employee experience (DEX). Digital employee experience is the overall sentiment of employees and end users as it relates to leveraging digital workspaces and assets. A negative experience doesn’t just hinder employee performance; it also results in wasted costs for companies.
Another closely related trend that is gaining traction is the evolution of infrastructure monitoring into observability. Observability enables admins to monitor the health of multicloud environments by analyzing the data it generates (such as Metrics Logs and Traces (MeLT)); it also helps admins detect and resolve the underlying causes of issues.
With the focus on DEX for better returns on investments, observability becomes a key pillar for understanding the overall performance and health of the rolled out digital experience infrastructure. Citrix Virtual Apps and Desktop and Citrix DaaS often form a key component in this overall ecosystem.
Observability and DEX: Customer goals and challenges
These are some of the common goals IT teams have when it comes to DEX and observability:
- Assess digital workplace impact in terms of business value, rather than IT-focused activity, throughput, and response time metrics
- Improve major incident and problem management processes by offering more data to determine root cause
- Have a real-time view into data to uncover unreported technology issues and set up automations to resolve recurring issues
To reach a future state where IT admins have complete control over the infrastructure and visibility into all data & assets, there are some inherent challenges. These include:
- Multiple organizations (network/security/IT operations) and handoff between these siloed teams for deployment, configuration, and monitoring increases challenges to gather data across various tool sets that are used by different departments.
- Complexity of deployments due to evolving infrastructures, new tool adoptions, and M&A activity – further compounded by disparate components, management services, policy, and configuration layers.
- Increase in scale and scope of applications and services. Hops across data controllers, gatekeepers, and Cloud PoPs can induce performance issues.
- Building a data lake and ecosystem with a variety of data sources and sinks and underlying technologies.
Common scenarios and key use cases
To get to the aforementioned business outcomes, you’ll want to build a single pane of glass for the infrastructure and digital workplace stack right from identity, endpoint, network, apps and services to the underlying HW and infrastructures. Administrators can leverage Citrix Analytics Service (CAS) data export interfaces to solve for variety of use cases, such as:
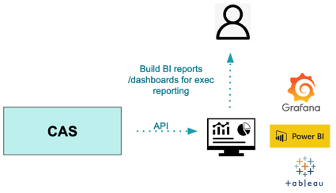
Reporting and dashboarding
With CAS data and interfaces you can unify all data and dashboards for Citrix infrastructure data without having to log in to multiple consoles. Two examples of reporting and dashboards you could set up include:
- Business intelligence reports and dashboards that lay out usage, licensing, and costs
- A technical triage, troubleshooting, and reporting dashboard based on session, application activity, machines from a capacity and health perspective
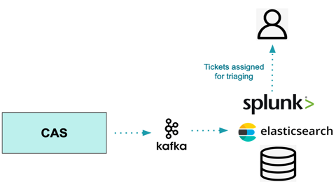
Ticketing and IT Service Management workflows
With Citrix Analytics you can streamline or automate the self-serve ticketing flow with helpdesk for faster triaging and handling of incoming end user tickets, including:
- Plugging-in ticketing, ITSM, and alerting tools for troubleshooting or IT systems failure notifications
- Generating helpdesk tickets proactively based on outages or session performance based on thresholds

Integrate and correlate with data from third-party monitoring tools
You can create an end-to-end view by correlating data from various data sources (end points, network, VDI and session hosts). This enables integration with multiple products and can help solve telemetry gaps due to data source limitation. It also enables you to collect data sets focussed on specific layers of the app delivery stack and go deeper with either vendor native interfaces or agents.

Centralized logging, data lake, and observability tool integrations
CAS integrations with observability tools and third-party data lakes enable admins to create a centralized console across expansive deployments.
With Citrix Analytics, you can bring data together with tools such as event management (SIEM) or observability which also offers advanced analytics, insights, and correlations. You can also aggregate and store data for long durations for audit, compliance, and post-incident triage purposes.
Export interfaces, capabilities and telemetry
We have enabled a variety of interfaces to provide flexibility to customers so that they can leverage all the data and insights available to them with Citrix Analytics.
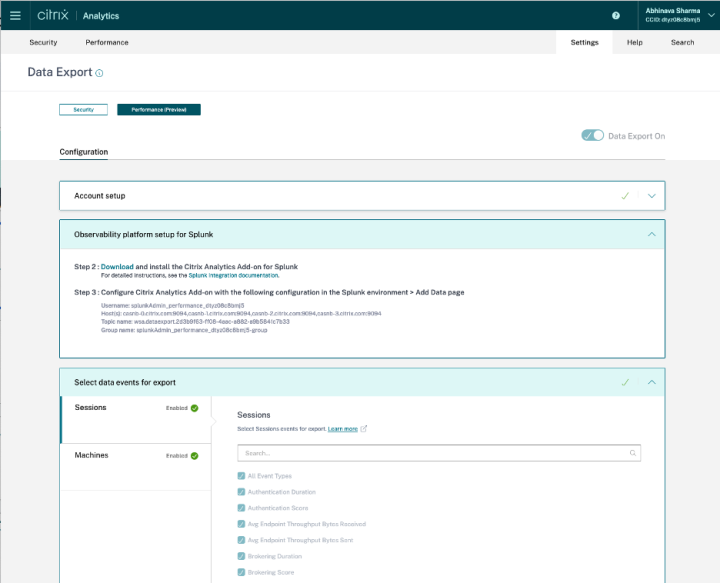
Streaming data exports based on Apache Kafka based push mechanism
-
- Ideal for populating large volumes of data to observability/SIEM or data lakes
- Provides a low-cost profile in terms of maintenance and management of integrations
- Data availability is near real-time and always on
- Data models for Performance Analytics (sessions, machines) and Security Analytics (data events and insights) are available via this mechanism
- Available for both Performance Analytics and Security Analytics data exports
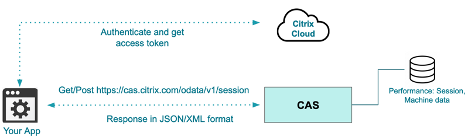
On-demand data exports based on Rest APIs (OData)
-
- Suitable for pulling data for Power BI and third-party tool integrations
- Deep data pull from ticketing tools or dashboard context, specific query sets for sessions, machines, users
- Currently available only for Performance Analytics (via private Tech Preview enrollment)
Real-time alerts based on Webhooks based on HTTP callbacks
- Enable real-time messaging between service provider applications and consumer applications for proactive monitoring; plugin into existing help desk workflows
- Ideal for alerts for ticketing tools such as Slack, ServiceNow, Zendesk, etc.
- The alert is sent in the form of a JSON payload through the HTTP POST or PUT request
- This functionality is currently available only for Performance Analytics

Get started today!
Citrix Analytics data export interfaces provide the perfect solution if you’re looking to unify monitoring across your IT stack, seamlessly integrate, aggregate & correlate data from other monitoring tools, or build your own data lake. With Citrix Analytics integrations you’ll be able to gain insights into health, performance, and business outcomes for your investments in Citrix Virtual Desktop & Apps and Citrix DaaS infrastructure.
Enroll in our latest private Tech Preview of data exports via Rest APIs (OData) for Citrix Analytics for Performance.
Learn more about our analytics offerings: Citrix Analytics for Performance and Citrix Analytics for Security. It will likely take you less than 60 minutes to connect an existing on-premises Citrix Virtual Apps and Desktops environment. Follow our PoC Guide to help you get started.
If you’re not yet a Citrix Cloud customer, you can sign up for a trial at analytics.cloud.com.
Disclaimer: The development, release and timing of any features or functionality described for our products remains at our sole discretion and are subject to change without notice or consultation. The information provided is for informational purposes only and is not a commitment, promise or legal obligation to deliver any material, code or functionality and should not be relied upon in making purchasing decisions or incorporated into any contract.