

Whether it’s your guilty pleasure, secret hiding place, or where you catch up on your email, if you can carry a screen in your hand, you probably have brought it to “the smallest room in the house”. As to the function of the room, I personally like the Spanish euphemism I learned years ago, “el sitio donde nadie me puede mandar“, loosely translated as, “the place where no one can tell me what to do”.
Let us accept that regardless of primary intent, the ability to carry everything from a laptop to a Kindle, iPad or phone into the bathroom, private or public, has changed the purpose or use of the bathroom and/or toilet. Those familiar with HCI and interaction design may consider this an additional affordance. beyond primary possible actions.
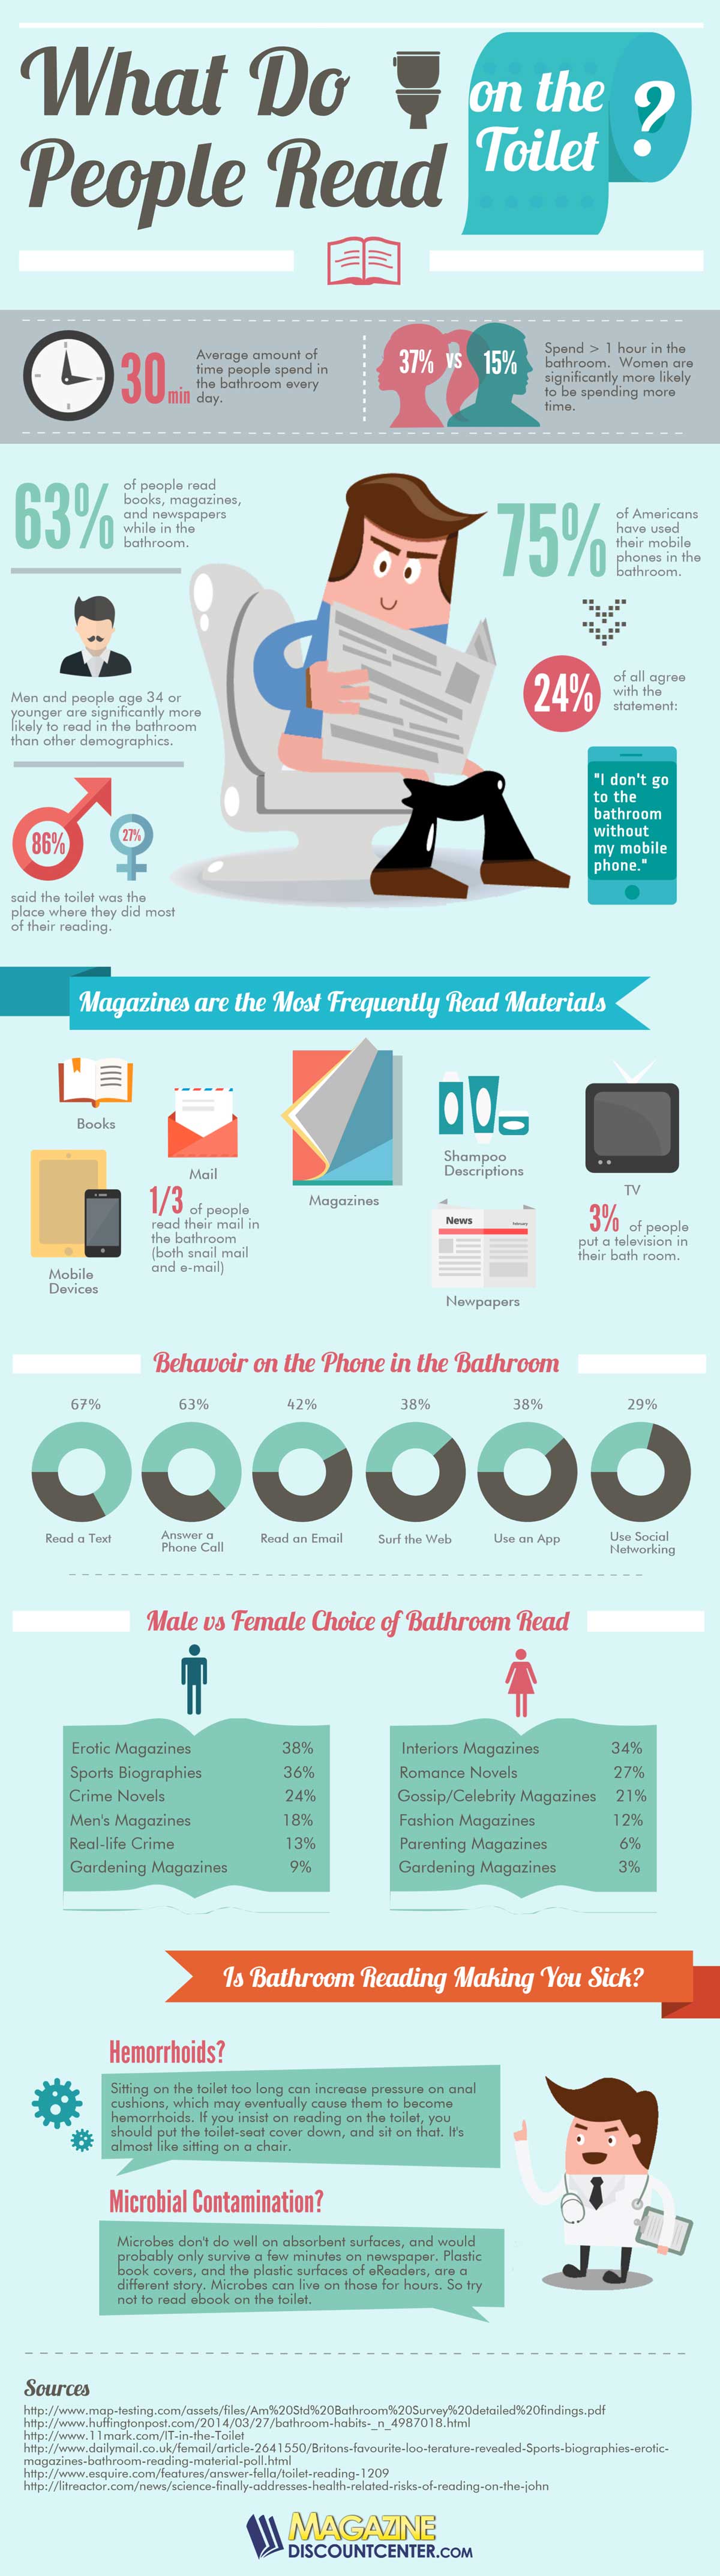
Nonetheless, the information in this infographic, aptly hosted by magazinediscountcenter.com and sourced by presumably reliable reports, indicate that it’s no small number of people, or at least Americans, who have used their mobile phones in the bathroom.
In fact, 75% of Americans, according to this infographic, have done so, and we don’t know how this is broken down between at-home and public restroom use. I will let VizWorld readers who are interested in these statistics research further, and possibly report back. If that research is done from the smallest room of the house, I would not venture to say whether or not that offers greater statistical proof.
The infographic itself only uses one formal type of chart: the doughnut type. I am not quite sure why the starting point for the percentage starts at the 9 o’clock position for the 6 items, as I believe starting at the 12 o’clock of the circle is more legible/understandable for any circular-area chart. At least it is consistent for the six doughnuts.
The flat art style and iconography is quite straightforward and text is easy to read.
The information, once you get past the image of toilet paper and the happy fellow on “the throne”, has important implications for content developers, marketers and writers.
It would be interesting to see the length of articles, books and video read and watched while in the bathroom.
But that calls for another, different infographic.
What’s your take on this infographic? And where did you read it?


Thanks for sharing such a pleasant thinking, post is good, thats why i have read it entirely
Asking questions are genuinely fastidious thing if you are not
understanding something totally, but this piece of writing presents pleasant understanding even.
[…] If you can carry a screen in your hand, you probably have brought it to "the smallest room in the house". What do people read on the Toilet? Infographic. […]