Article summary
JMeter is a load testing tool for a variety of network services. It supports features such as parameterization, assertions, cookies, and additional functionality through plug-ins.
Ordinarily, when testing web services, JMeter relies heavily on HTTP status codes and headers. However, certain protocols and query languages that are served over HTTP (i.e. GraphQL) do not make use of HTTP status codes and headers as expected. As a result, errors in response to a GraphQL query must be considered separately from the HTTP status code.
In JMeter, the distinction between successful requests and failed requests is critical. If the tested application begins to experience issues under heavy load and requests begin to fail with errors that JMeter does not detect, developers may make inaccurate assumptions about the performance characteristics. For example, the developers could assume that, based on testing with JMeter, an application can handle a certain level of traffic that, in actuality, it cannot.
GraphQL Errors
Developers who are familiar with REST APIs and legacy web applications probably rely on HTTP status codes to indicate whether a request for a resource has completed successfully. For example, with a REST API request, a response code in the 200 range is generally accepted as successful, whereas a response code in the 400 or 500 range is considered an error.
GraphQL, on the other hand, can bundle up the requests for multiple resources into a single HTTP request. The HTTP response can contain information about all of those resources, even if some of the resource requests result in errors. In such cases, the entire HTTP response will still have a successful status code (e.g. “200 OK”).
In fact, even if the body of the GraphQL HTTP response contains only error data, the HTTP status code will still be successful. This is true even if the error arises from something serious: an unexpected internal error or dependency failure that prevented a resource from returning correctly. (Serving over HTTP | GraphQL) The server will only return something other than a successful HTTP response if it encounters a very serious error itself (not just the application running on it).
For example, the following GraphQL response data is accompanied by an HTTP status code of “200 OK.”
{
  "data": {},
  "errors": [
    {
      "message":"An error has occurred",
      "name":"Timeout",
      "time_thrown":"2016-11-11T00:40:50.954Z",
      "data":{
        "reason": "3rd party API timed out"
      }
    }
  ]
}
New Expectations
JMeter presumes that all failed requests have a non-200 status code. Clearly, this presents a bit of a problem when using JMeter to performance-test an application that uses GraphQL. How can JMeter detect and report errors if the response’s HTTP status code is “200 OK,” but the response body indicates an error?
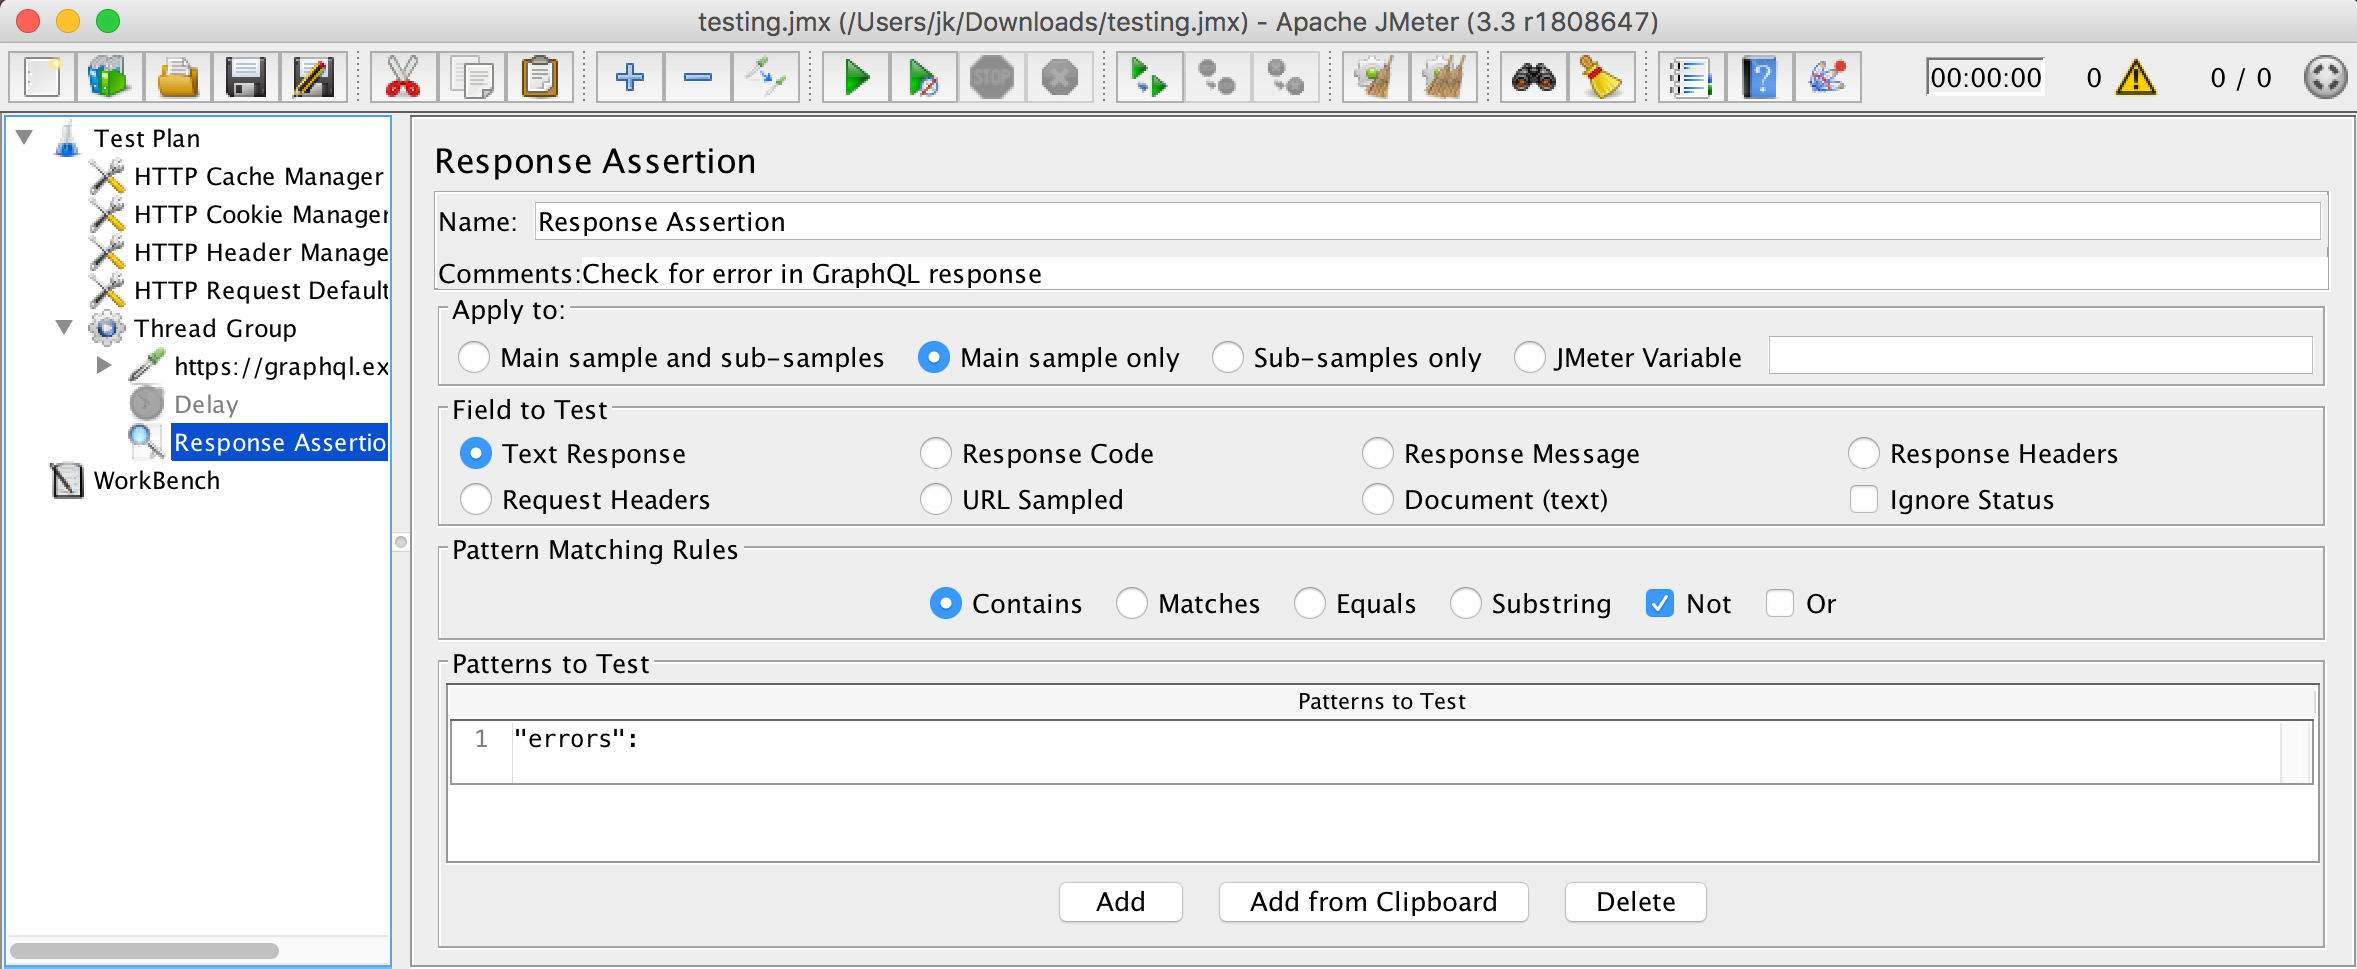
Fortunately, JMeter allows you to create assertions for the HTTP response body of requests. An assertion states that a response body should (or should not) contain a value. For GraphQL, the value of concern is "errors": . Per the GraphQL spec, if no errors occurred, then the "errors" key should not be present in the response data map.
When configured with such an assertion, JMeter will mark the request as having failed if it detects the value "errors": in the response body.
Assertion Configuration
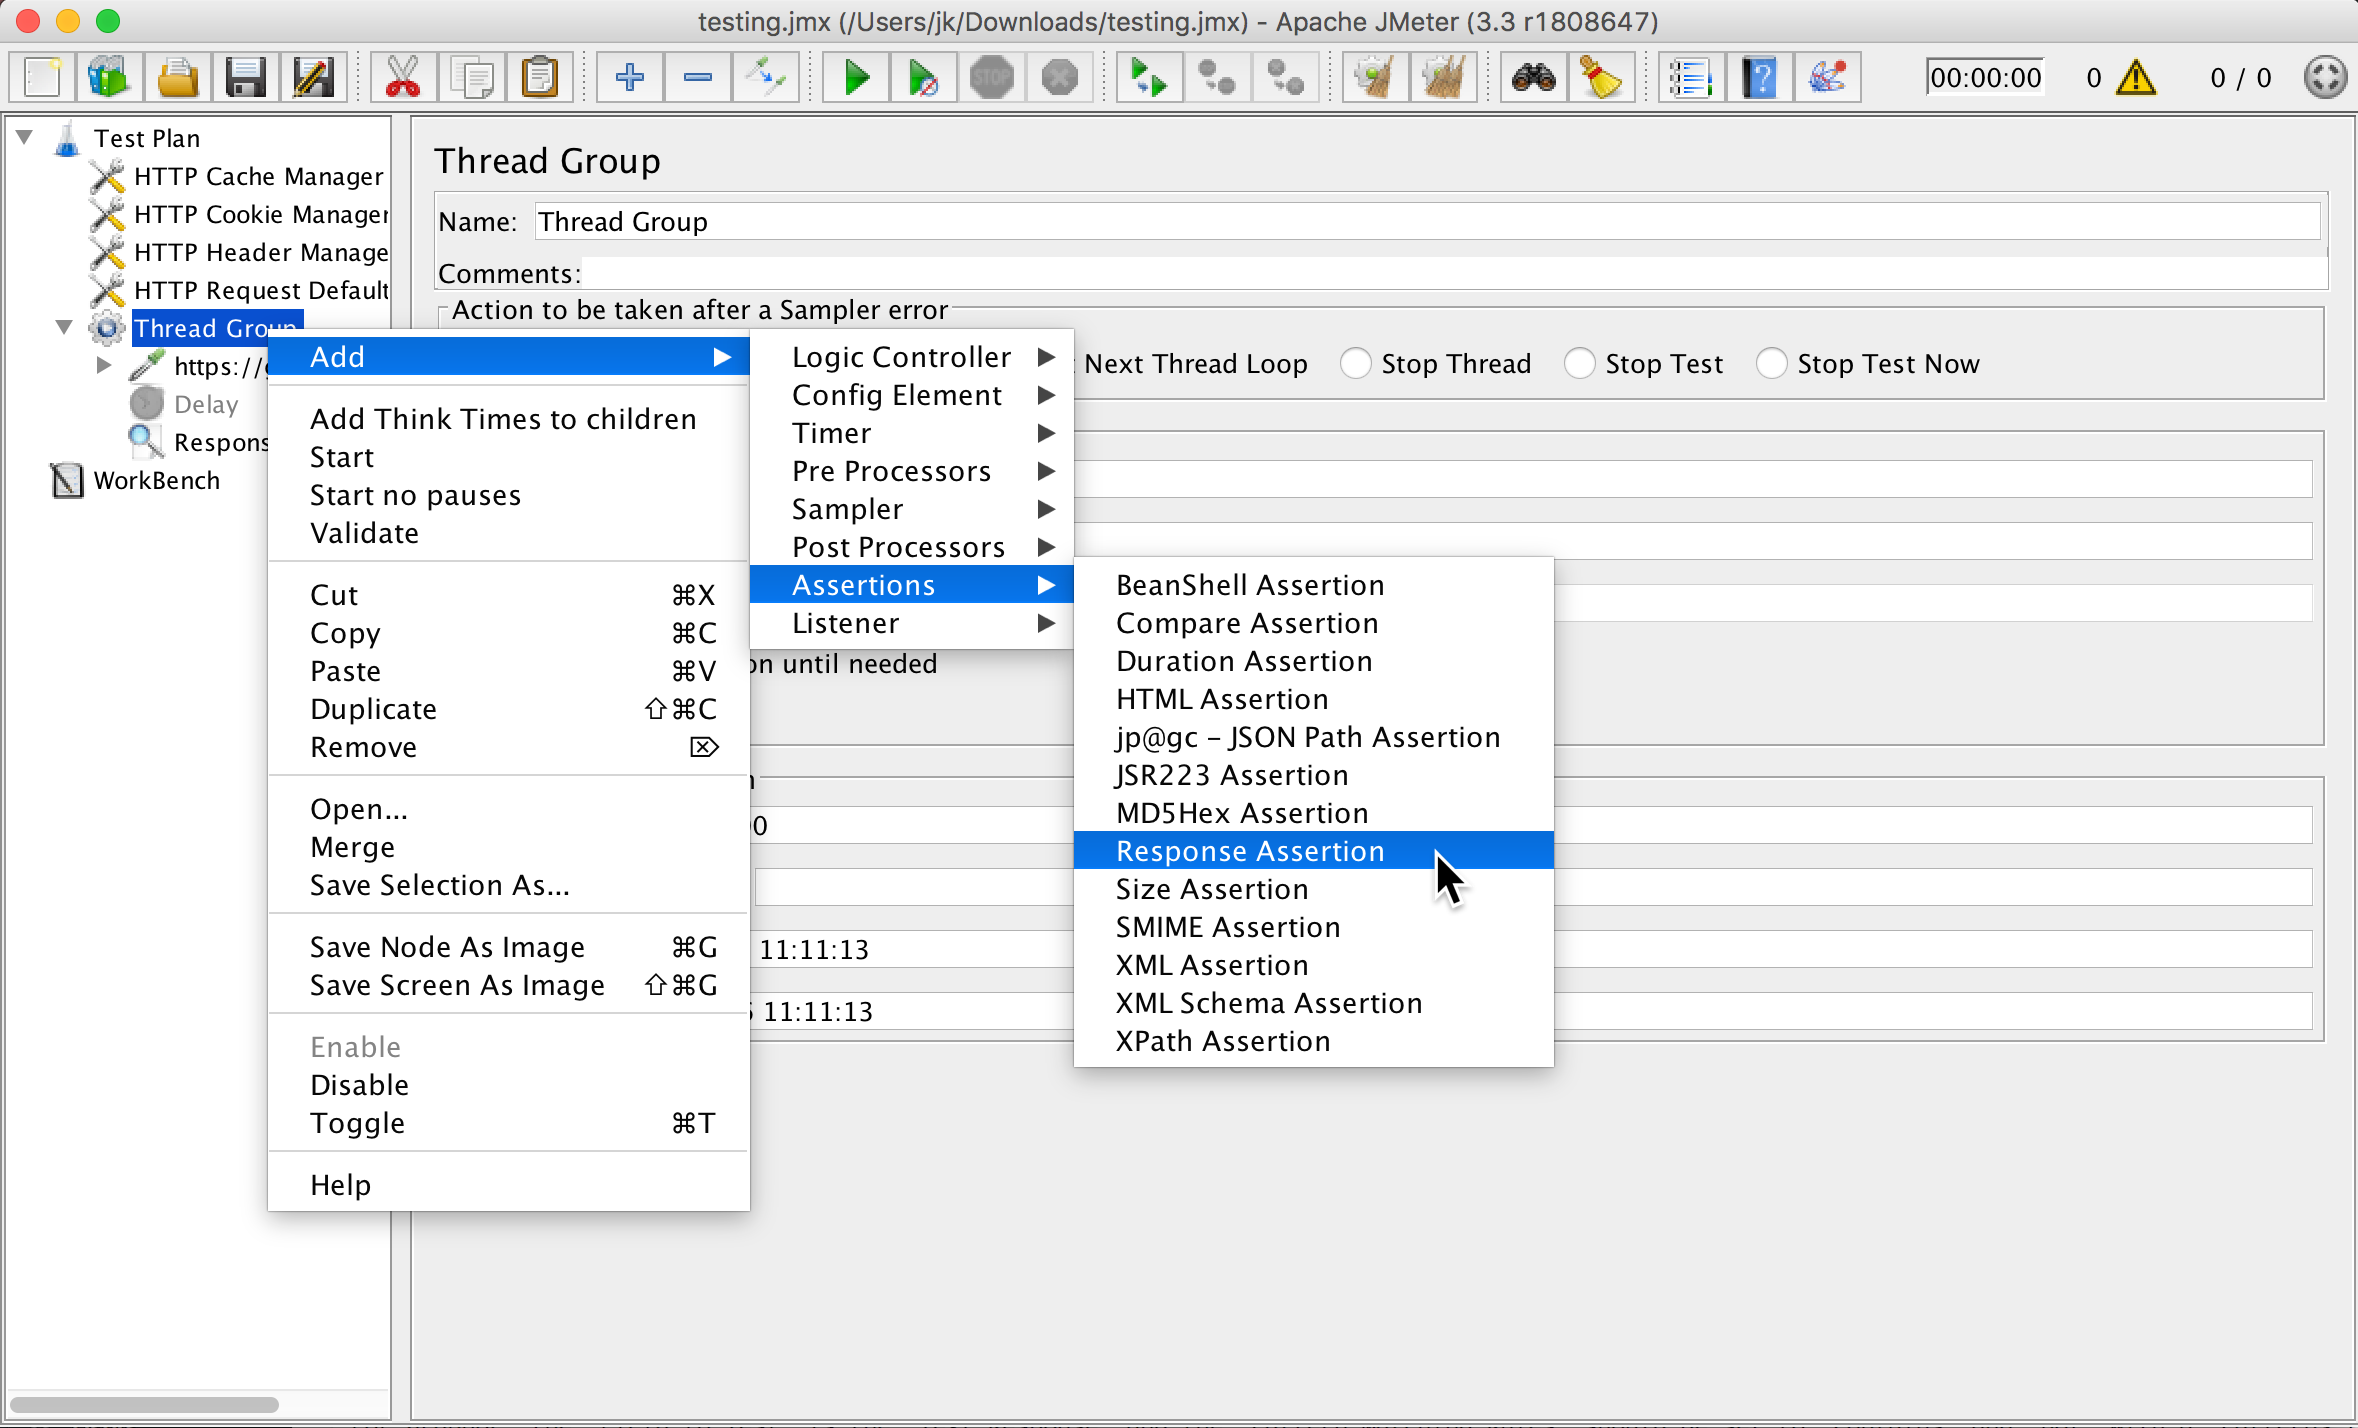
In JMeter, assertions can be configured on individual samplers (individual requests) or on entire thread groups. The response assertion can be found under: “Add > Assertions > Response Assertion.”
The “Field to Test” is the “Text Response,” and the “Pattern Matching Rules” should be set to “contains” and “not” with a “Patterns to Test” of "errors":.