Article summary
Debugging JavaScript can be frustrating sometimes, or at least time-consuming. To reduce the amount of suffering invovled, I’m going to share some of the processes that I take to debug JavaScript in the browser. I’ll focus on the debugging tools offered by the unexplored Console api. There’s a lot of good functionality beyond the tried-and-true console.log.
The Basics
When it comes to debugging JavaScript in the browser, don’t forget about the basics. console.log needs no explanation, but don’t leave it behind–it may also be all you need for simpler bugs.
debugger can also be invaluable for hunting down bugs. Its ability to explore the state of the program and the DOM can’t be duplicated with a lot of other tools.
console.group
When trying to log groups of data from a section of code called more than once, console.group is a fantastic tool for grouping the console logs into collapsible sections. It’s typically called in pairs: one to open a group, and one to close the group.
console.group('Group Name') will open up the next group for console logs to be placed. A call to console.groupEnd() will close the last group that was opened. An example of what this would look like is below.
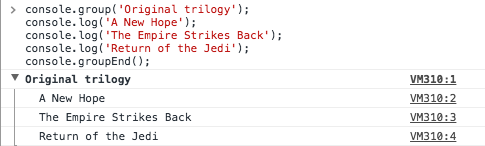
The inconvenient part about using console.group is that, by default, the groups start in an opened format. To have your groups start collapsed, just make a call to console.groupCollapsed instead of console.group.
Lastly, groups can be nested an arbitrary number of levels. Feel free to organize your logs with as many levels of logging as you need.
console.count
The next function seems like it might be a little simple, but the implementation adds more helpful functionality for debugging.
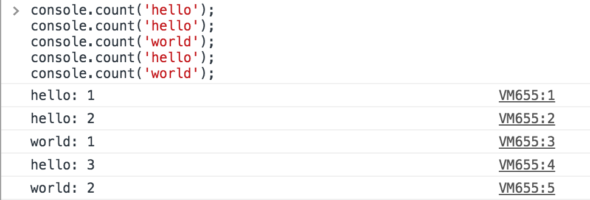
console.count('label') will print out the label and the number of times that label has been counted. The important part to note here is that it can recognize the label across your app. The example below will give a quick overview of how this might look when used in your app.
console.table
console.table offers another option for visualizing groups of data in a more digestible way. The use case for this function is a lot more narrow than console.group, but there’s still a good case for it.
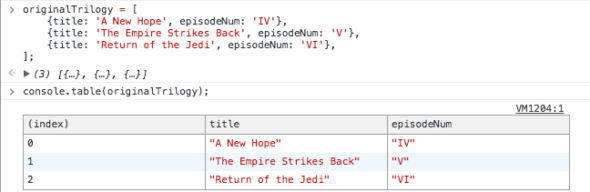
console.table takes in an array. The simplest use is to put a list of strings into a table. The function can also handle putting an array of JavaScript objects into an HTML table, with each column representing a property on the object. When logging the objects, you can include a second array of strings to whitelist the properties to include in the table. There’s a small example below that helps demonstrate the output.
console.trace
Tracking down how your code got to where it is can sometimes provide the insight you need to solve your bug. Putting down your own series of log messages everywhere you may have called your function is one solution, but console.trace is much easier. Wherever console.trace is called, a full call stack to the current function will be output, and all of the call locations and line numbers will be linked to the output.
I hope some of these functions of the Console api are new to you and aid you in your debugging.