Article summary
My primary role at Atomic Object is an embedded developer. Most of my business hours are spent reading and writing C code. However, over the past couple months, I have been dabbling in web application development in my free time.
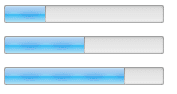
The other day I needed to display some time-based information on a webpage, and I thought a progress bar would be an ideal fit. I assumed making a progress bar on a webpage would require a fair amount of CSS and Javascript magic, so I began what I thought was going to be a long and arduous process by googling “html progress bar.” I was quite surprised to find that HTML5 includes a new tag called progress.
HTML5 Progress Element
The progress tag is a tool intended to visually display the progress of a task. Using it is as simple as setting the min and max attributes and then adjusting the value attribute to display the current progress. Here’s an example:
The progress tag turned out to be exactly what I was looking for. But I also had some temperature information that I wanted to display on my webpage. While I was reading through some of the documentation for the progress tag, I came across another similar tag that I found very interesting: the meter tag.
HTML5 Meter Element
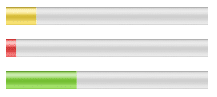
The meter tag is useful for displaying a value within a given range and applying a style to the display to indicate how close the current value is to the optimum range. Like the progress element, meter includes min, max, and value attributes. But it also includes low, high, and optimum attributes, which can be used to define what ranges of values are high, medium or low.
The optimum attribuite defines which section of the range is desirable. If the high range is optimal, values in the high range are represented with a green bar, values in the medium range are yellow, and values in the low range are red. If the low range is optimal, the colors are reversed. If the medium range is optimal, then values between high and low are green and values in the high and low ranges are displayed as yellow.
The meter element could be perfect for showing the output of something like a thermostat or temperature controller. The target temperature could be marked as the optimum value. Then, the current temperature could be assigned to value and the control would provide colorful feedback of how well the temperature controller is operating.
Customizing Progress & Meter
Adjusting the Style
The engineer side of me loves the progress and the meter tags: they are very basic and incredibly simple to use. However, the artistic side me of is a bit disappointed. After reading through the documentation, I found that styling them is not a simple task. If you’re not satisfied with the default look and feel of these items, you have to delve pretty deep into browser-specific CSS and potentially some Javascript in order to change them.
Check out this page for more information on styling progress bars if your interested.
Adding a Scale
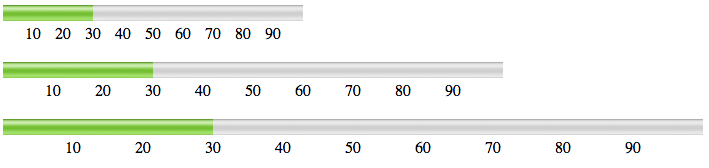
Unfortunately, neither the progress tag nor the meter tag have a built-in way of displaying a scale along with the graph. However, with a little extra HTML and CSS, you can make one that automatically sizes to fill a parent container.
- 10
- 20
- 30
- 40
- 50
- 60
- 70
- 80
- 90