


Although many wrote off the biotech IPO markets as moribund earlier in 2016, the sector has been quietly issuing a steady stream of new offerings. Despite the volatility related to drug pricing, and disastrous first six-weeks of the year, we’ve recently witnessed the 24th biopharma IPO of 2016. For context, in the past two decades, other than the recent window, we’ve only seen more than two dozen VC-backed IPOs in three vintage years. In light of these metrics, and despite the negative sentiment and malaise about biotech IPOs, it’s actually been a historically very strong year in terms of new offerings.
Further, to add to the growing positive sentiment, the recent biopharma IPOs have been strong: dermatology-focused Novan (NASDAQ:NOVN) and Alzheimer’s antibody play AC Immune (NASDAQ:ACIU) priced in the range and both jumped up, closing their first day of trading up 95% and 50%, respectively. Whether these prices will hold is anyone’s guess, but positive initial trading tends to have a reinforcing effect on investor sentiment – especially when the NASDAQ Biotech Index has had such poor performance year-to-date.
As we head into the final quarter of year, it’s worth revisiting the performance of the largest and most prolific window in biotech history – the 2013-2016 cycle. As most readers can guess, there’s some good and some bad in the analysis.
Let’s start with post-IPO stock performance by annual class, as per the chart below.
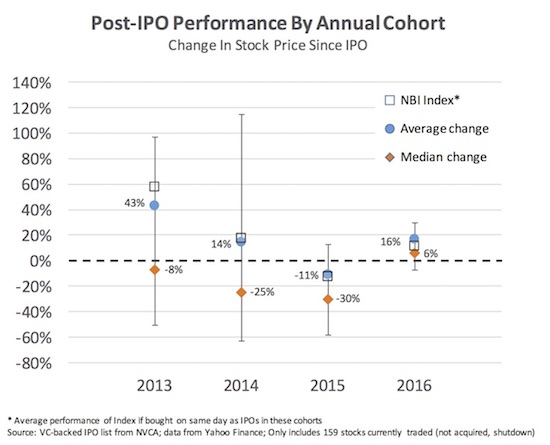
Four observations of these data. First, the median underperforms, like most asset classes. The bottom half have largely destroyed value in each of the 2013, 2014, and 2015 IPO classes. Many of these represent stories where their lead drug failed (in case you didn’t know that pharma R&D is hard). Second, the top quartile performers of 2013 and 2014 have done well, but most of the 2015 Class is off the mark. This is largely due to the downdraft in the NASDAQ Biotech Index in the second half of 2015; many of the offerings priced when the markets were solid only to see fund flows pour out of the sector and drive prices down after July. Third, the 2016 Class is off to a solid start despite the volatility in the markets – an average return of 16% so far. Some of the bigger outliers include pulmonary disease company Reata (NASDAQ:RETA, up 136%), gene therapy player AveXis (NASDAQ:AVXS, up 113%), and cystic fibrosis play Proteostasis (NASDAQ:PTI, up 90%).
And fourth, to understand how the macro biotech trends shaped the after-market performance of these IPOs, we compared it to the Index as if it were bought on the same day as the IPOs of that year – and then looked at the average performance. As is clear in the chart, top quartile IPOs performed in line with the Index, with significant skew above that for the top performers.
As with prior cycles, a rather large proportion of these IPOs are currently underwater. Of the 159 IPOs that are still trading from the 2013-2016 window (excluding post-IPO M&A), less than half are above their IPO prices (43%). But one of out of six offerings are up over 100%.
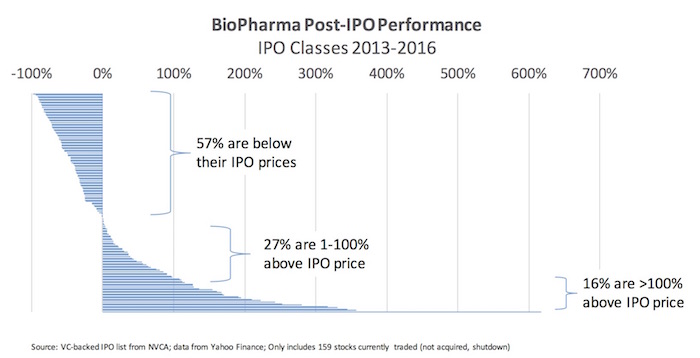
With 57% of the offerings below their IPO price, have these IPOs as a cohort destroyed value since their offerings? Not at all. The chart below says it all – laying out the puts and takes on value.
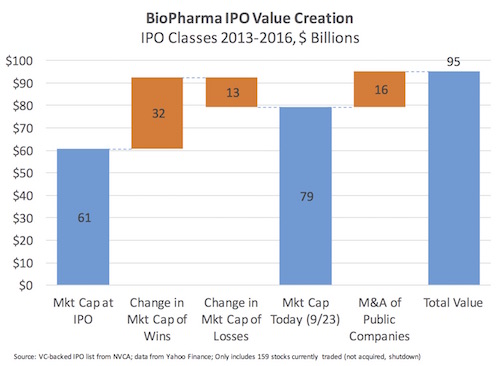
At the time of their offerings, these 159 stocks had a market capitalization of $61B. The winners – the 43% that have traded up – have added $32B in market value since their IPOs. The not-so-fortunate loss-makers – the 57% that have traded down – have destroyed $13B. This includes some of the big blowups, like Tetralogics, Globeimmune, and ProNai and a number of others, that are off more than 90% since their offerings. To get a full picture of the value creation, we have to add back to the market value the acquisitions of recently IPO’d companies (e.g., Receptos for $7.2B, Auspex for $3.2B, and ZS Pharma for $2.7B). This contributes an additional $16B to total.
Summed up, the IPO window of 2013-2016 has created or added some $95B in market value since their initial offerings. That’s like creating one Bristol Myers Squibb in less than a 4-year period.
The outliers are a big part of this contribution: the winners often win big. It should not be news to anyone that it’s the top quartile and top decile returners that drive most of the gains. The top 16% of companies with >100% stock upticks since their offerings (~25 companies) delivered nearly 80% of the positive change in aggregate market value.
These data highlight the importance of picking winners.
As a closing perspective to put biotech in context, it’s worth reflecting on the concept of dispersion. Stock analysts often refer to the “dispersion” of returns in a sector: the degree of variance in returns within that sector over time. In general, there’s a widely-held belief that the higher the dispersion in a sector, the more likely stock-picking drives value (versus simply picking a good sector). BMO Capital Markets team covered this topic in their February/March 2016 issues of “What We’re Thinking About This Month”, and highlighted a relevant piece on this concept of dispersion. A quick and dirty measure of dispersion is the average standard deviation in 12-month returns of the stocks in sector.
The chart below captures data at a sector level on the left (source here) for 2014, which includes all stocks in a sector with market capitalizations bigger than $200M. These sector dispersion rankings largely hold for the ten-year period of 2005-2014 as well, with Pharma and Biotech topping those charts there as well.
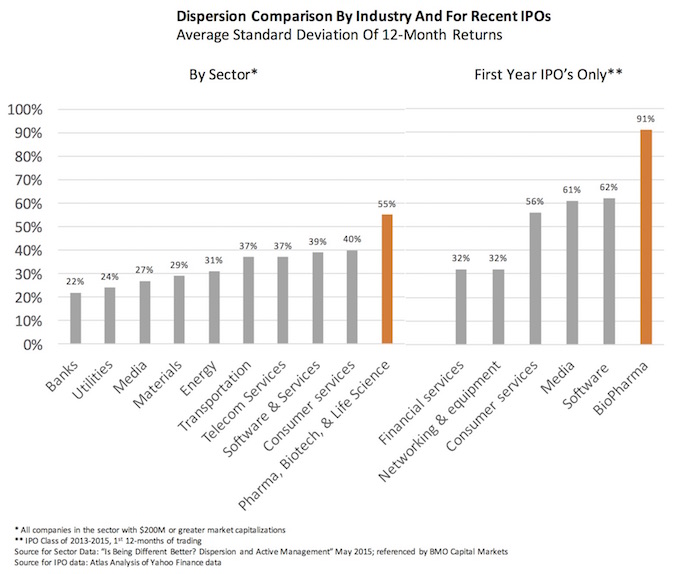
To draw a comparison with broader sector data, the dispersion of returns of recent VC-backed IPO cohorts in their first year post-trading is on the right. As one would expect, these less seasoned stocks have greater variance – more dispersion of returns – than the broader pool of companies in the sector data on the left: biopharma IPOs have a chart-topping 91% dispersion in their first year of trading. This dispersion of returns is bigger than any other VC-backed IPO sector. And even after “seasoning” the dispersion in biopharma is sector-leading.
All this reinforces the message that picking the winners is a big part of investing in the world of biopharma. Importantly, in the long run of the capital markets, winners are typically those who’s drugs make it through the gauntlet of R&D and deliver value for patients.